● Blazor WebAssembly · No backend

Explore your graph database in the browser.

Connect to Gremlin, openCypher or SPARQL, run a query, and see your data as an interactive 2D or 3D graph, a table, or raw JSON — edit it and commit changes back, or generate a whole graph from text with AI.

Runs entirely in your browser — nothing to install to try it, and your queries and connections never leave your machine.
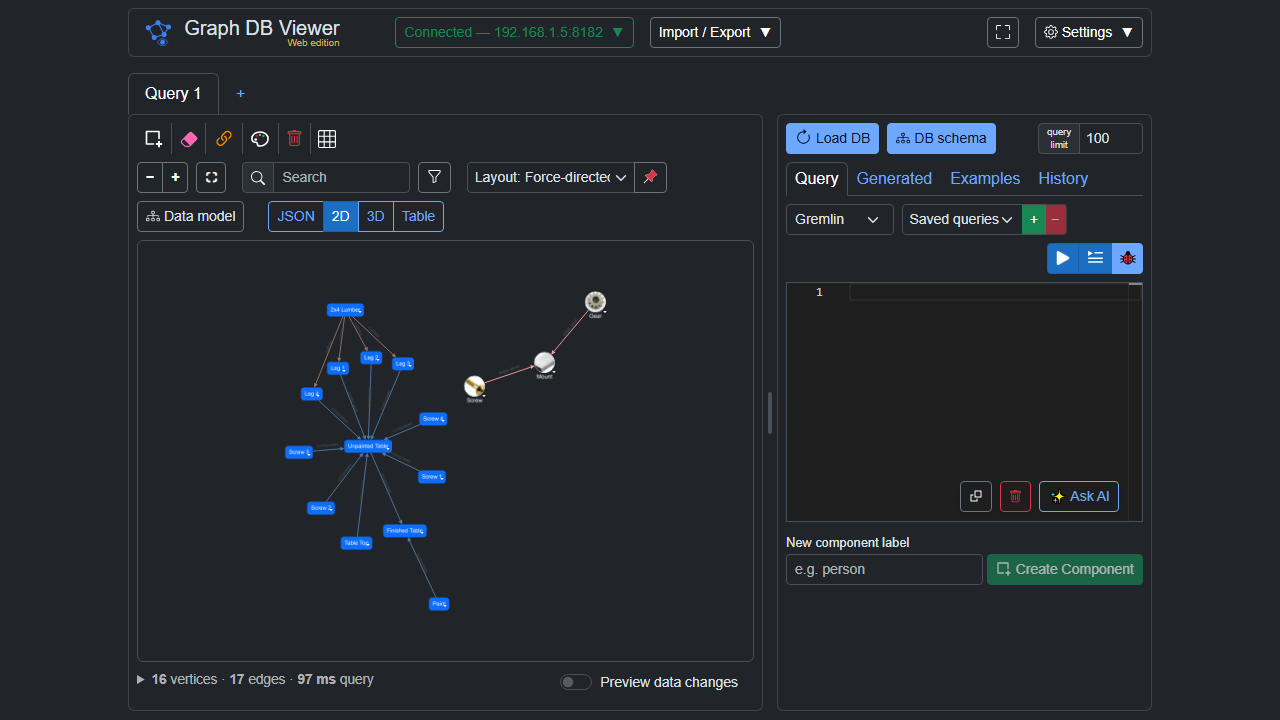
2D graph view
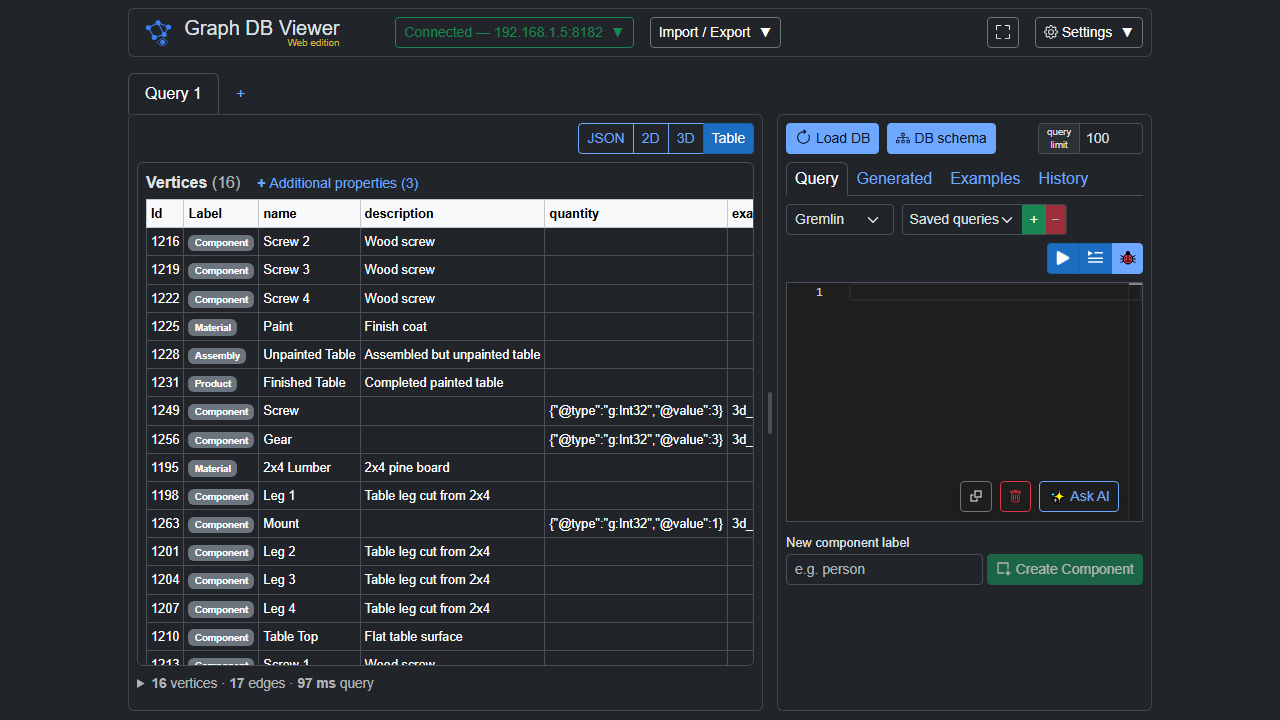
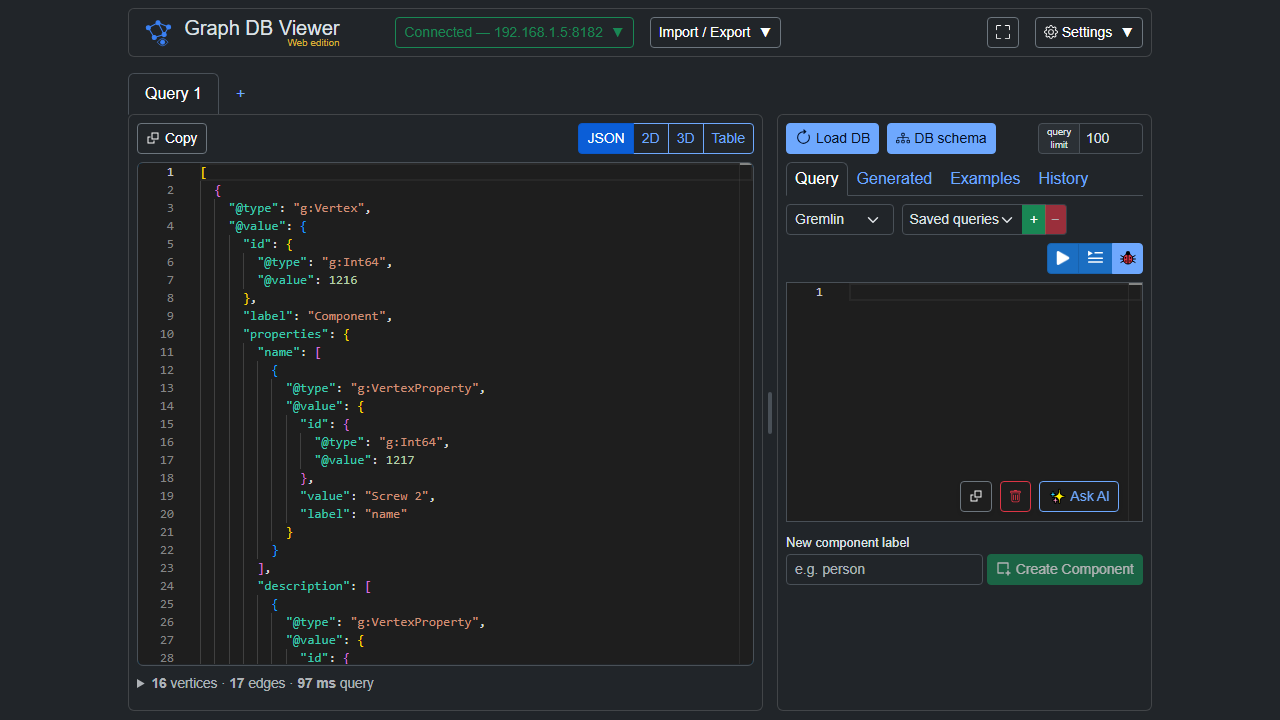
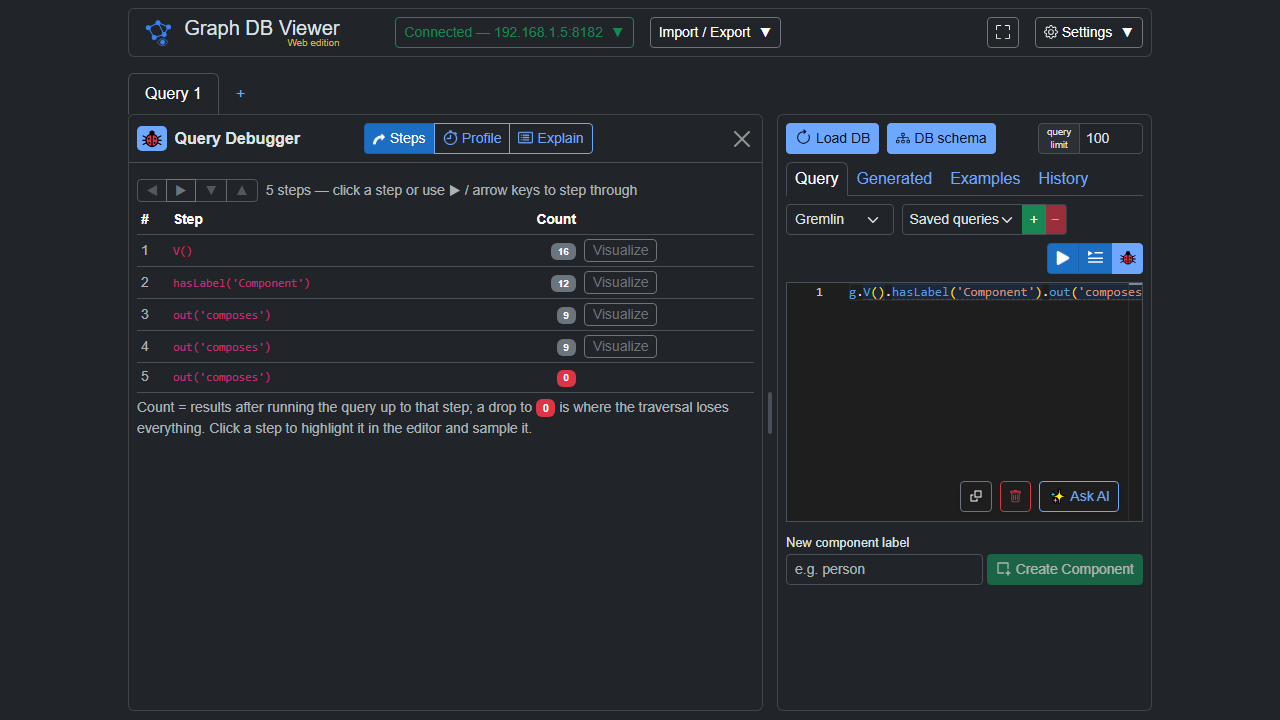
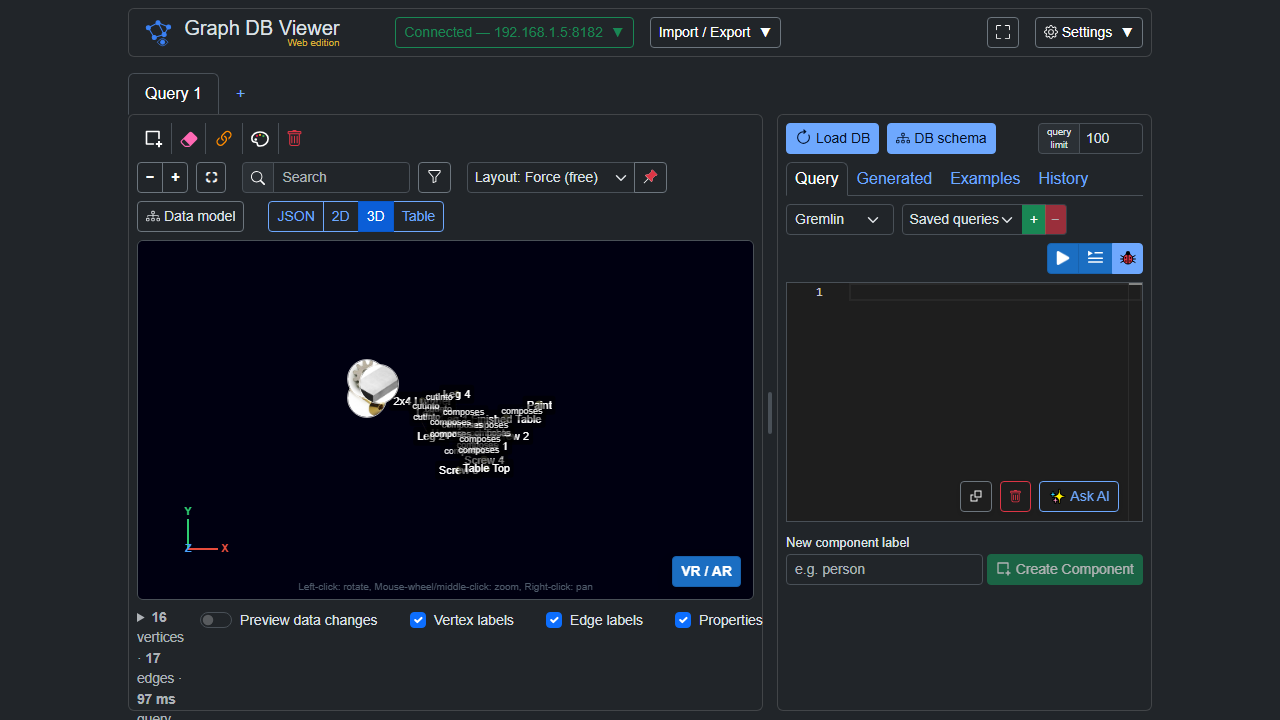
The full app showing a loaded graph in the interactive 2D view The full app showing the same graph in the interactive 3D view The full app showing the results as a vertices and edges table The full app showing the raw JSON results The full app showing the step-through traversal debugger
4view modes: JSON · 2D · 3D · Table
12graph layouts (6 in 2D, 6 in 3D)
3query languages highlighted
0servers to run — 100% in-browser
Everything you need to explore a graph

One page, no install. Connect, query, visualize, debug and edit — then export the result.

🔌

Browser-direct connections

Talk to your database with no proxy in between.

  • Gremlin over WebSocket or HTTP
  • Azure Cosmos DB (HMAC-SHA256 auth)
  • SPARQL / RDF endpoints
  • Saved connections, SSL toggle, status badge
🧠

Schema-aware editor

A vendored Monaco editor that knows your graph.

  • Gremlin, openCypher & SPARQL highlighting
  • Autocomplete from real labels & property keys
  • Context-aware suggestions & auto-indent
  • ✨ Ask AI in plain English — Anthropic · OpenAI · Gemini (bring your own key)
🎨

Four ways to see it

Flip any result between views instantly.

  • Interactive 2D (Cytoscape.js) & 3D (three.js)
  • Property table & raw JSON
  • Per-label styling · edge colours · image & 3D-model nodes
  • WebXR VR/AR viewer with a phone QR
🐞

Traversal debugger

gdotV-style step-through for Gremlin.

  • Traverser count after every step
  • Zero-drops highlighted
  • Profile & Explain tabs · mutation-safe
✏️

Safe graph editing

Mutations are staged and committed on your word.

  • Add / edit / delete vertices, edges, properties
  • Two-click edge creation
  • Review generated queries before commit
📥

Import & export

Bring data in, take pictures out.

  • Paste GraphSON, Graphviz DOT or Mermaid — or draw offline
  • ✨ Generate a graph from text, files or Wikipedia
  • Export CSV · Excel · PNG/JPEG/SVG · Graphviz/DOT · 3D models

See your data the way that makes sense

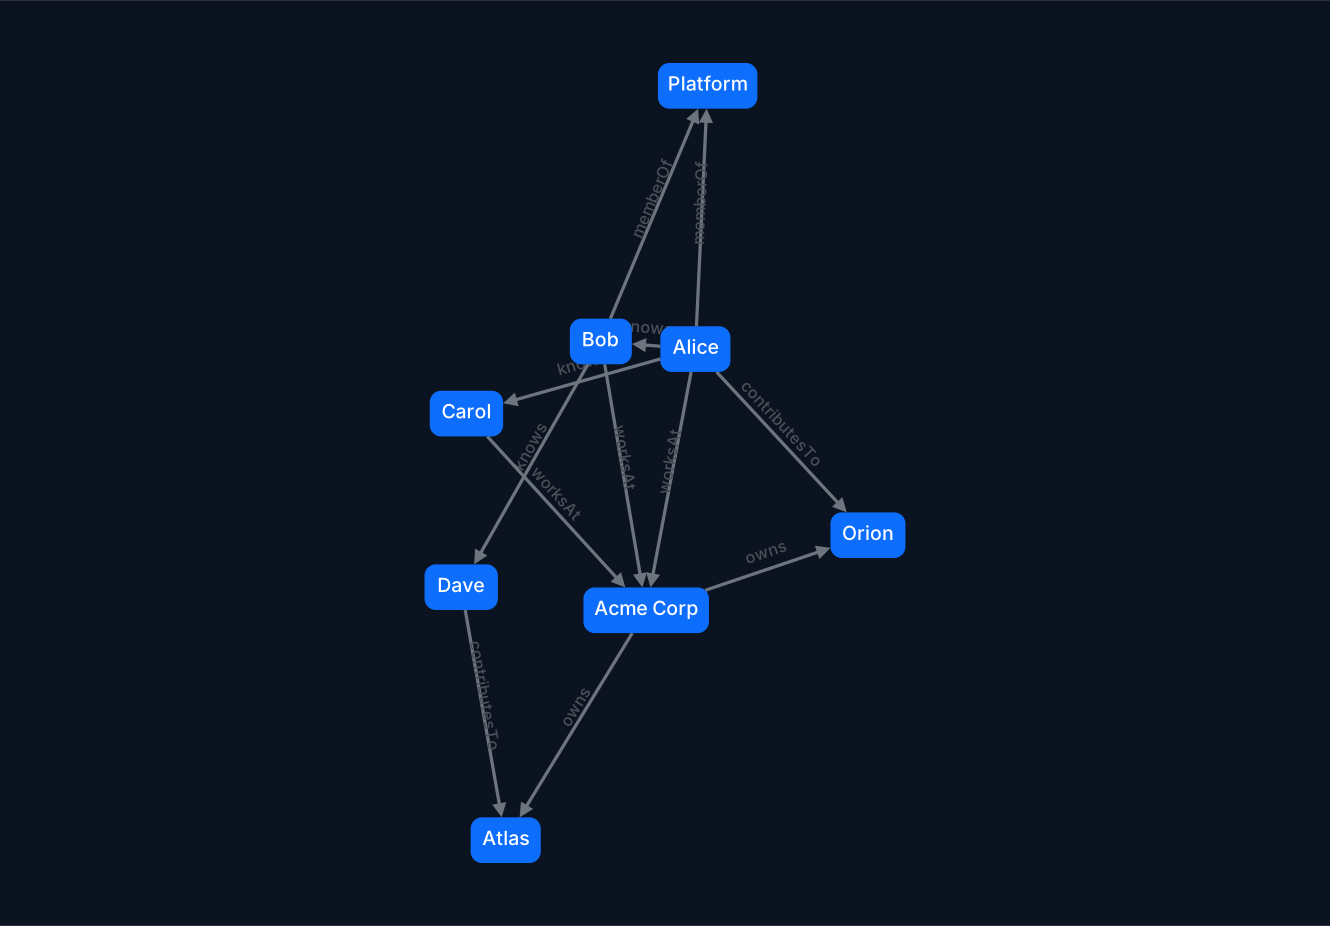
Every result is one click away from four representations, with a search box and per-label filter in both graph views. Style each vertex label with its own colour, size, display property and icon.

Force-directedTreeConcentric CircleGridRadial 3D Double-click to expandMultiple tabs
The sample graph shown in the interactive 2D view

Write in the language your database speaks

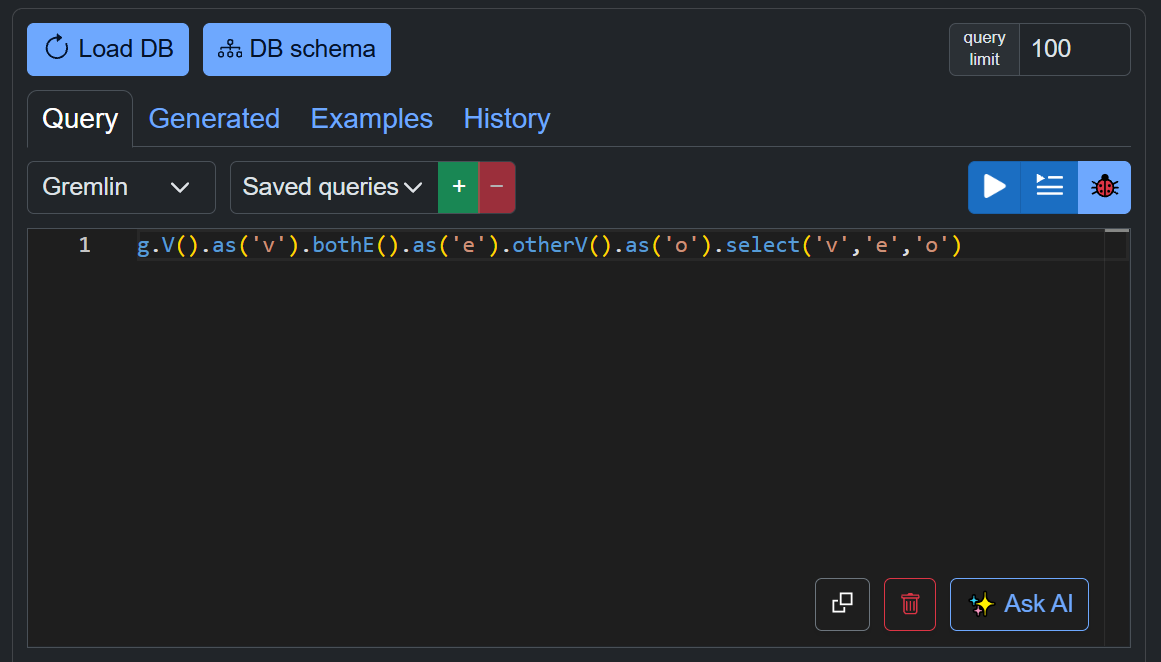
A self-hosted Monaco editor highlights Gremlin, openCypher and SPARQL, auto-closes brackets and quotes, and completes real vertex labels, edge labels and property keys pulled live from your database.

GremlinopenCypherSPARQLSchema autocomplete
The self-hosted Monaco query editor showing a syntax-highlighted Gremlin query

Turn text into a graph

Paste notes, drop in a Word, Excel or CSV file, or name a Wikipedia article — an AI model extracts the entities and relationships and draws them, ready to review before anything is saved.

Generate a knowledge graph with AI

Bring your own model — Anthropic, OpenAI, Gemini or any OpenAI-compatible server. The app asks for strict JSON, cleans it up (merging “Acme” and “Acme Inc.” into one node), and previews the counts, labels and every repair before you accept. Then merge it into your drawing or replace it — and write to a database only when you say so.

AnthropicOpenAIGemini Word · Excel · CSVWikipedia Entity de-duplicationMerge or replaceReview before commit
"Alice, an engineer at Acme,
 works with Bob on the Table project."

Person Alice —[worksAt]→ Company Acme
Person Alice —[worksWith]→ Person Bob
Person Alice —[worksOn]→ Project Table
4 nodes · 3 edges · previewed before drawing

Find out where your traversal goes wrong

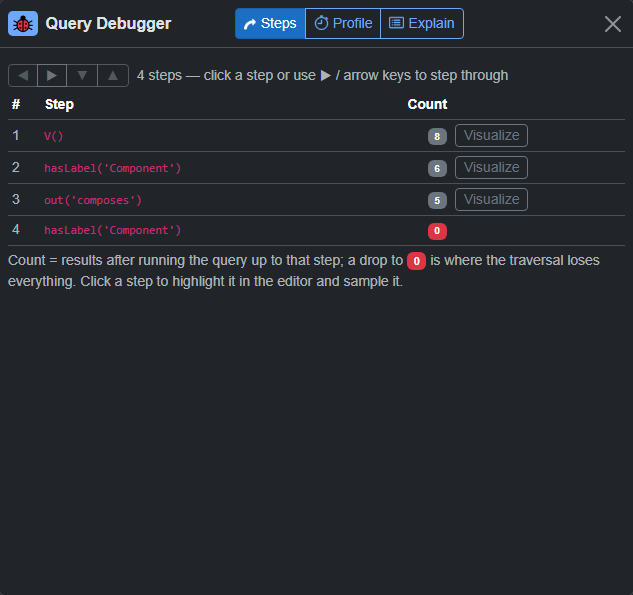
The step debugger re-runs your query truncated at each step and shows how many traversers survive — so a query that returns nothing stops being a mystery.

The step debugger showing the traverser count after each step, with the final step dropped to zero highlighted in red

Each step shows the traverser count; the red zero is where every result was dropped — click any step to visualize that intermediate result in 2D or 3D.

Connects to the graphs you already use

Anything reachable from your browser over WebSocket or HTTP (with CORS) works — no server component required.

DatabaseProtocolStatus
Apache TinkerPop / TinkerGraphGremlin over WebSocket or HTTP✔ Supported
Azure Cosmos DB (Gremlin API)Gremlin + HMAC-SHA256✔ Supported
Fuseki · Blazegraph · GraphDB · VirtuosoSPARQL 1.1 over HTTP✔ Supported
Wikidata · DBpedia (public)SPARQL over HTTPS✔ Supported
Neo4j · Memgraph · ArangoDB · DgraphCypher / AQL / DQL◷ On the roadmap

Try it in your browser

Nothing to install — open the live demo and load a built-in sample graph or paste a Mermaid diagram. Prefer to run your own? It's a static Blazor WebAssembly app: clone the repo and start the dev server.

# or run your own — requires the .NET 10 SDK & git
git clone https://github.com/EECSB/GraphDBViewerWeb.git
cd GraphDBViewerWeb/GraphDBViewerWeb
dotnet run
# → http://localhost:5154  ·  already cloned? git pull