About
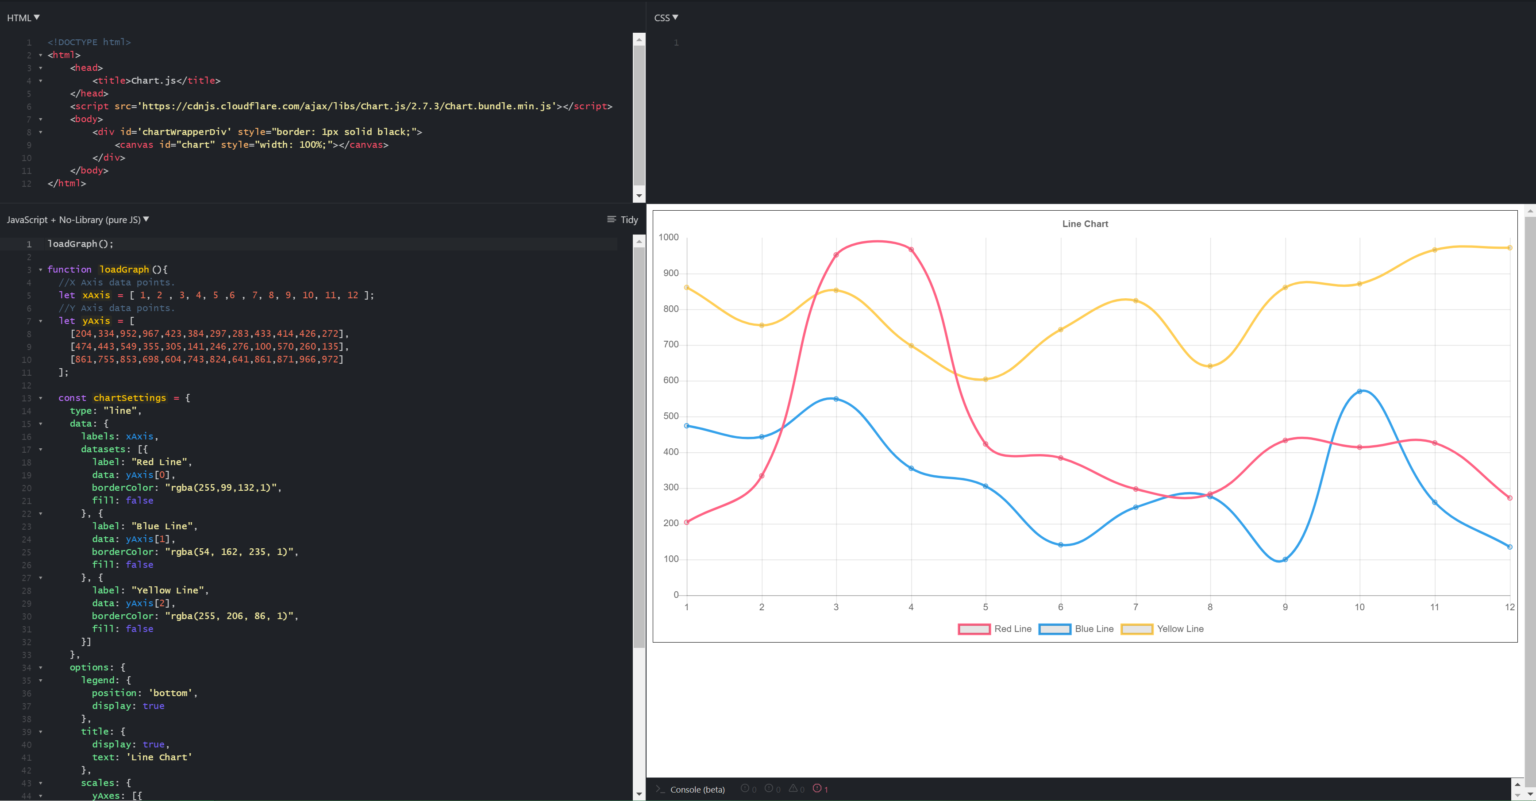
In this code snippet, we’ll learn how to make graphs with Chart.js in Javascript.
Chart.js is a very nice javascript library that allows you to visualize data by making different kinds of graphs/charts/plots. We’ll make a simple line graph in this example.
Note: If you want to know how to make other types of graphs(bar, scatter, pie, …) check out the official documentation here. I was going to cover that in this post but they have everything very well documented with nice code examples.
Let’s see the example below.
Code:
In the HTML we need to include the Chart.js library and add a canvas element with an id we’ll reference later from the code.
html
<!DOCTYPE html>
<html>
    <head>
        <title>Chart.js</title>
    </head>
    <script src='https://cdnjs.cloudflare.com/ajax/libs/Chart.js/2.7.3/Chart.bundle.min.js'></script>
    <body>
        <div id='chartWrapperDiv' style="border: 1px solid black;">
            <canvas id="chart" style="width: 100%;"></canvas>
        </div>
    </body>
</html>
javascript
loadGraph();

function loadGraph(){
  //X Axis data points.
  let xAxis = [ 1, 2 , 3, 4, 5 ,6 , 7, 8, 9, 10, 11, 12 ];
  //Y Axis data points.
  let yAxis = [
    [204,334,952,967,423,384,297,283,433,414,426,272],
    [474,443,549,355,305,141,246,276,100,570,260,135],
    [861,755,853,698,604,743,824,641,861,871,966,972]
  ];

  const chartSettings = {
    type: "line",
    data: {
      labels: xAxis,
      datasets: [{
      	label: "Red Line",
        data: yAxis[0],
        borderColor: "rgba(255,99,132,1)",
        fill: false
      }, {
      	label: "Blue Line",
        data: yAxis[1],
        borderColor: "rgba(54, 162, 235, 1)",
        fill: false
      }, {
     	 	label: "Yellow Line",
        data: yAxis[2],
        borderColor: "rgba(255, 206, 86, 1)",
        fill: false
      }]
    },
    options: {
      legend: {
      	position: 'bottom',
      	display: true
      },
      title: {
        display: true,
        text: 'Line Chart'
      },
      scales: {
      	yAxes: [{
        	ticks: {
          	beginAtZero:true,
         	}
        }]
      }
    }
  }

  //Get canvas.
  let canvas = document.getElementById("chart");

  //Make a new chart.
  let chart = new Chart(canvas, chartSettings);
} 


