About
In this post, we’ll learn how to set up the Xdebug debugger for PHP in Visual Studio Code.
Xdebug Install:
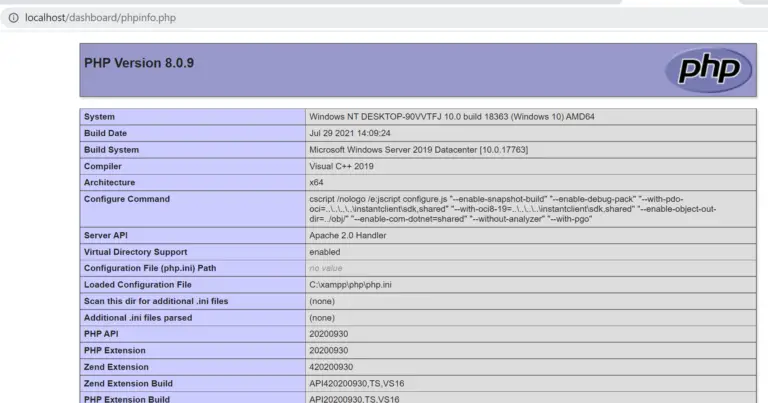
First, you will need to get the php info page. This can be done by making a script that simply calls the phpinfo() function when run.
In my case, I’m using XAMPP for development so I can just navigate to this URL: http://localhost/dashboard/phpinfo.php and get the info page.
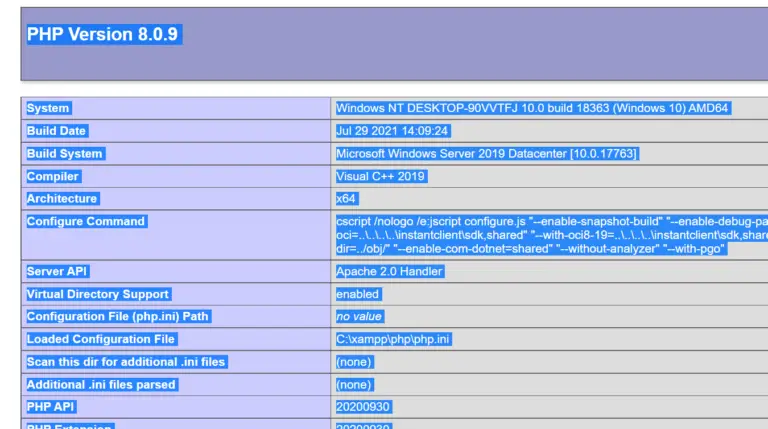
When you get on the info page select all the text(ctrl + a) and copy it(ctrl + c).
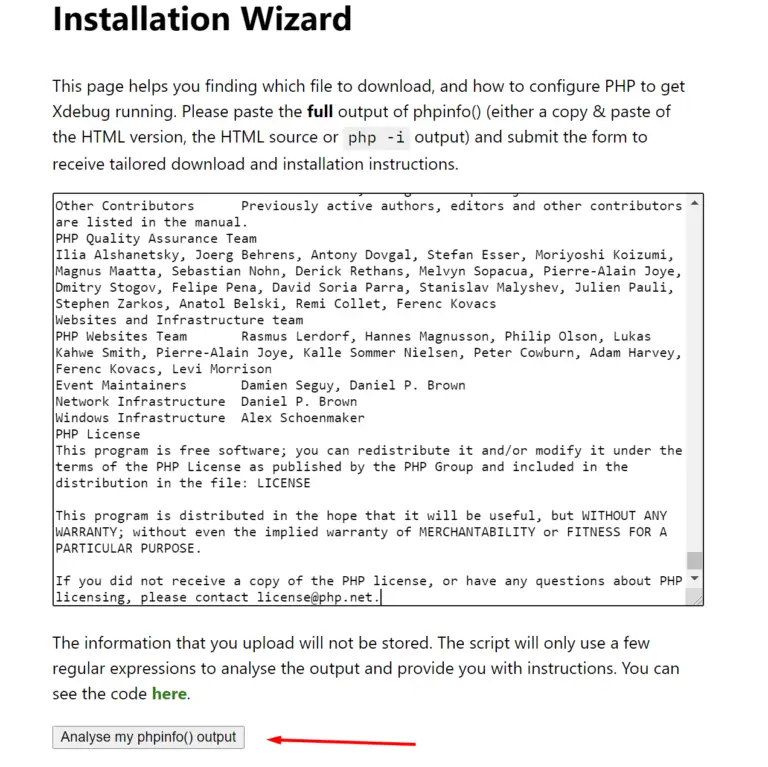
Paste(ctrl + v) the copied text into the text area on the Xdebug page: https://xdebug.org/wizard and click the “analyse” button.
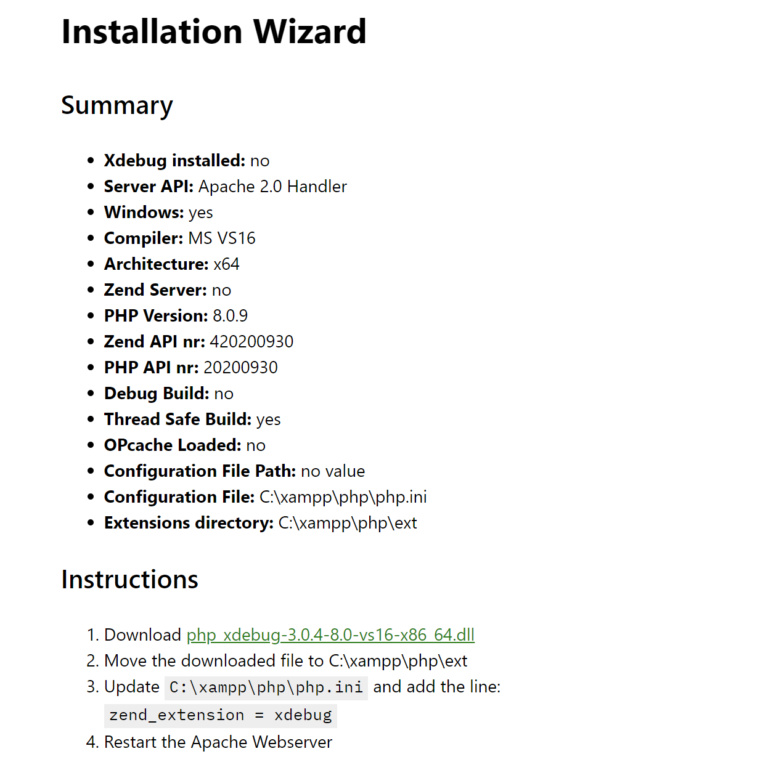
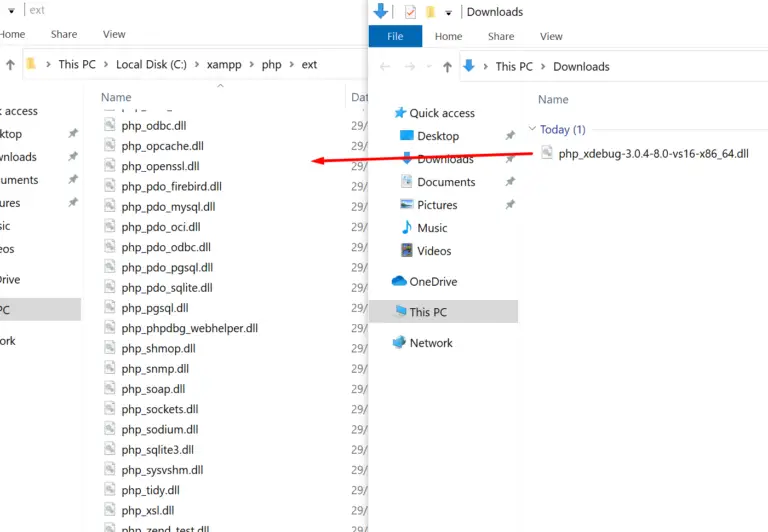
You need to download the provided .dll
Then you need to place it into the php extension folder. In my case I’m using XAMPP so the path to the folder is: C:\xampp\php\ext
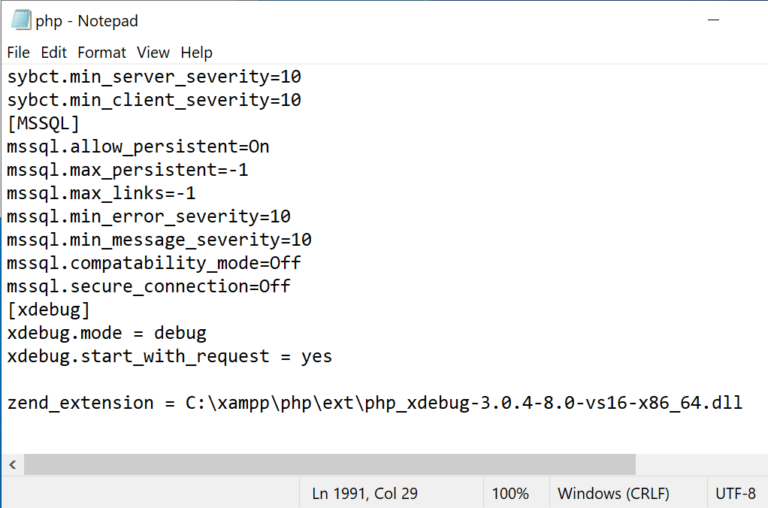
Finally, open up php.ini(again in my case I’m using XAMPP so the path is) at C:\xampp\php\php.ini and add the following lines at the end of the file:
[xdebug]
xdebug.mode = debug
xdebug.start_with_request = yes
zend_extension = C:\xampp\php\ext\php_xdebug-3.0.4-8.0-vs16-x86_64.dll
Save the file and start/restart the server.
VS Code:
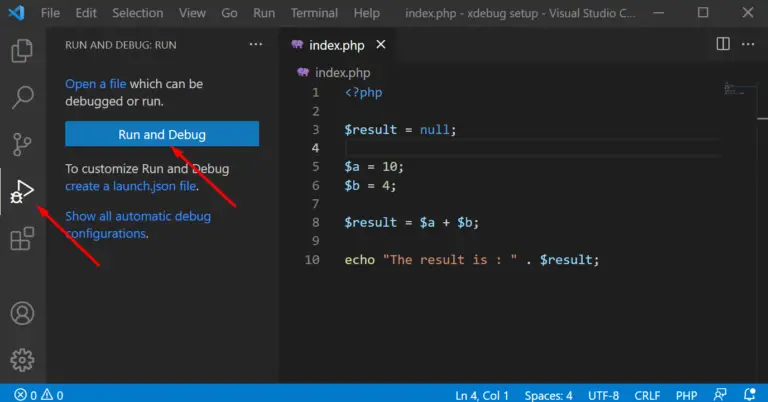
First, open up your project in Visual Studio Code and click on the debugging icon, then click the “Run and Debug” button.
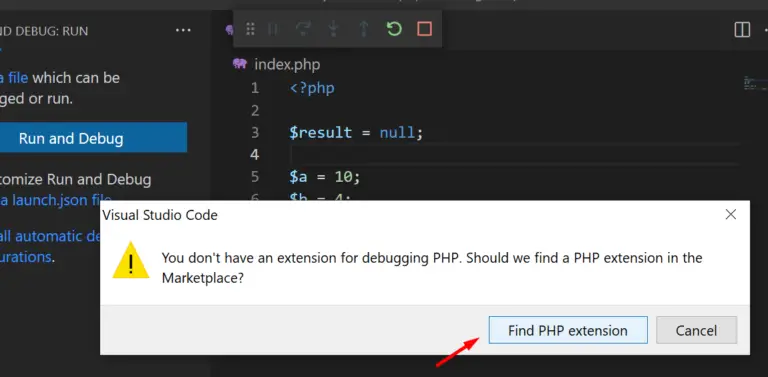
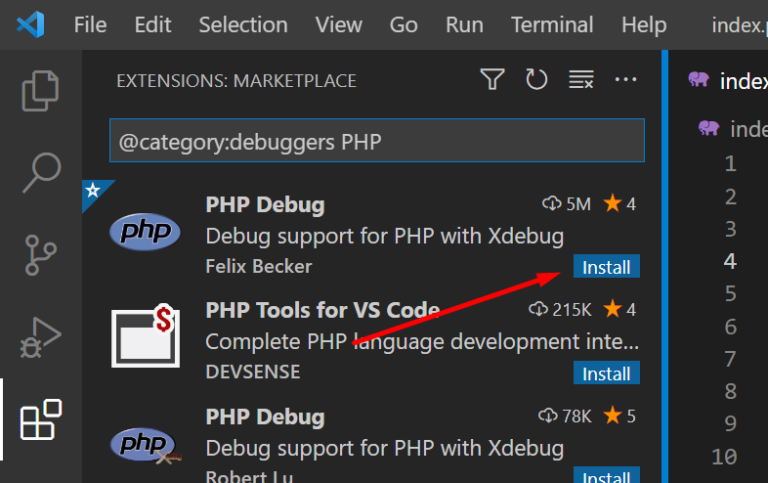
Find the extension in the marketplace.
Install PHP Debug.
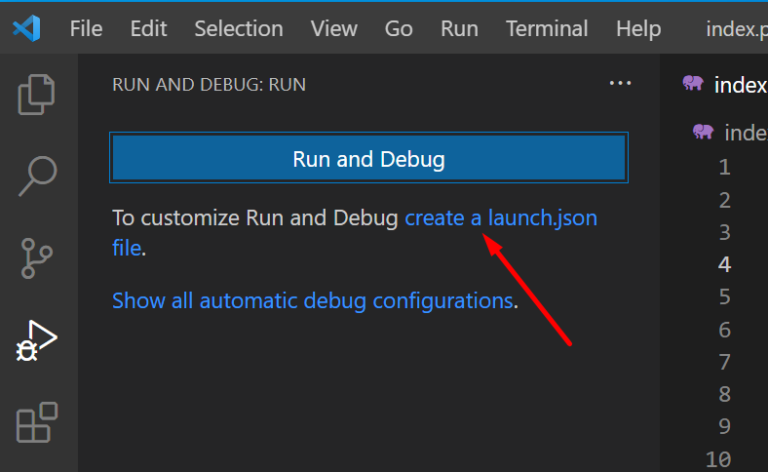
Go back to the debug tab and click the “create a launch.json file” link. This will automatically create a debug configuration file.
Result:
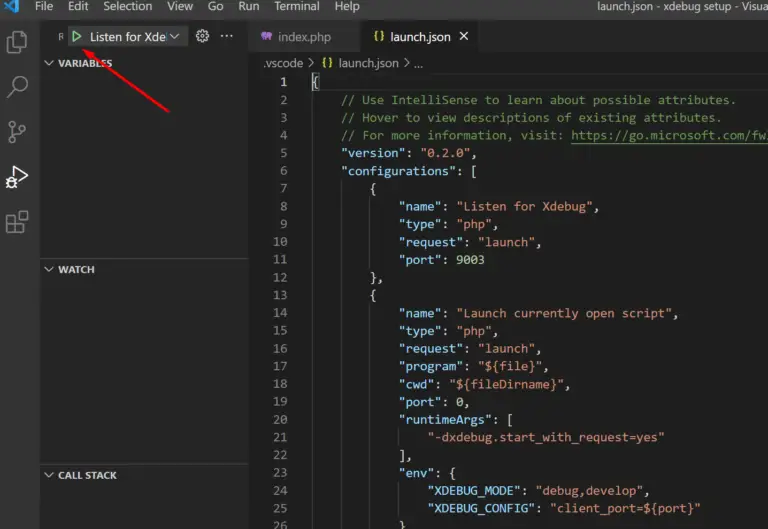
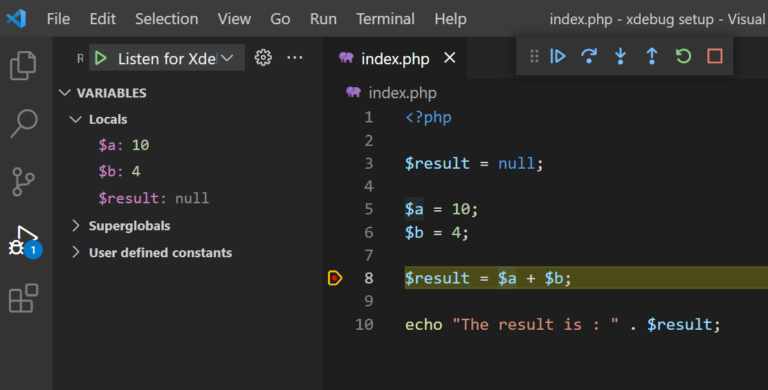
Press the green debug button with the “Listen for Xdebug” option selected in the dropdown and the debugger should startup.
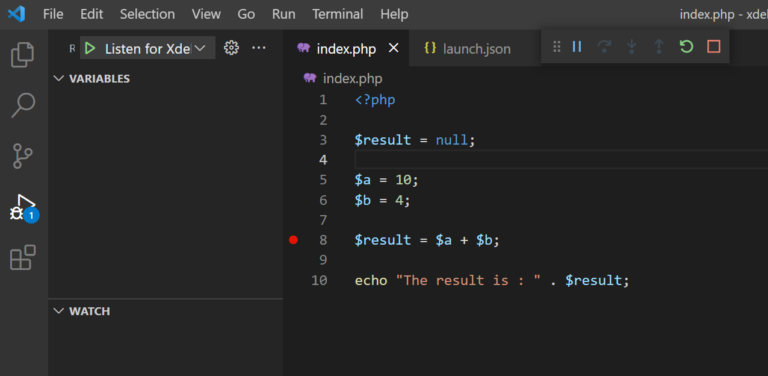
Now you can set a breakpoint, call your script and the debugger should stop on it and show you the current variable values in the left tab.

