In this post, we’ll take a look at some of the very useful developer tools available in Google Chrome.
If you press F12 Chrome Dev Tools will open up. Here you will be able to see the source files of the webpage you are on, the console with erros, warnings and messages, memory usage, networking, …
We’ll have a quick overview of some of the usefull chrome dev tools.
Note:You can find the official documentation here.
The first icon in the toolbar is the inspect element tool. When selected you can hover over and click any element only on your page and you will be taken to the HTML(elements tab) that defines it. In the Elements tab, you can view and modify the HTML and CSS of the current page.
Testing Responsive Design
The next icon can be used to switch between the mobile/tablet/desktop modes. This way you can make sure your design is responsive and resizes properly. The page window can also be manually resized to any desired size.
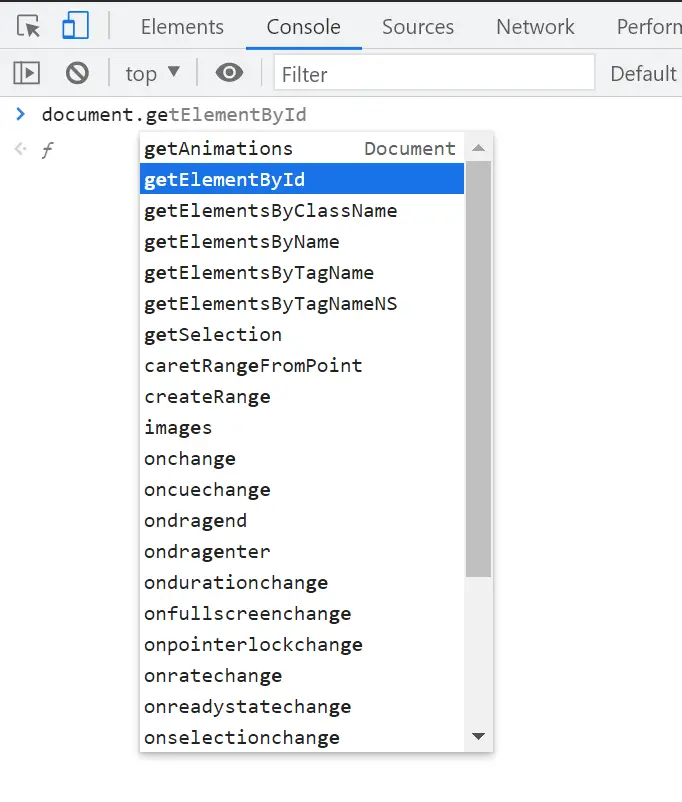
Console
In the console errors, warnings and messages(like from console.log()) will be shown. You can also directly write and execute Javascript from the console to help yourself while debugging.
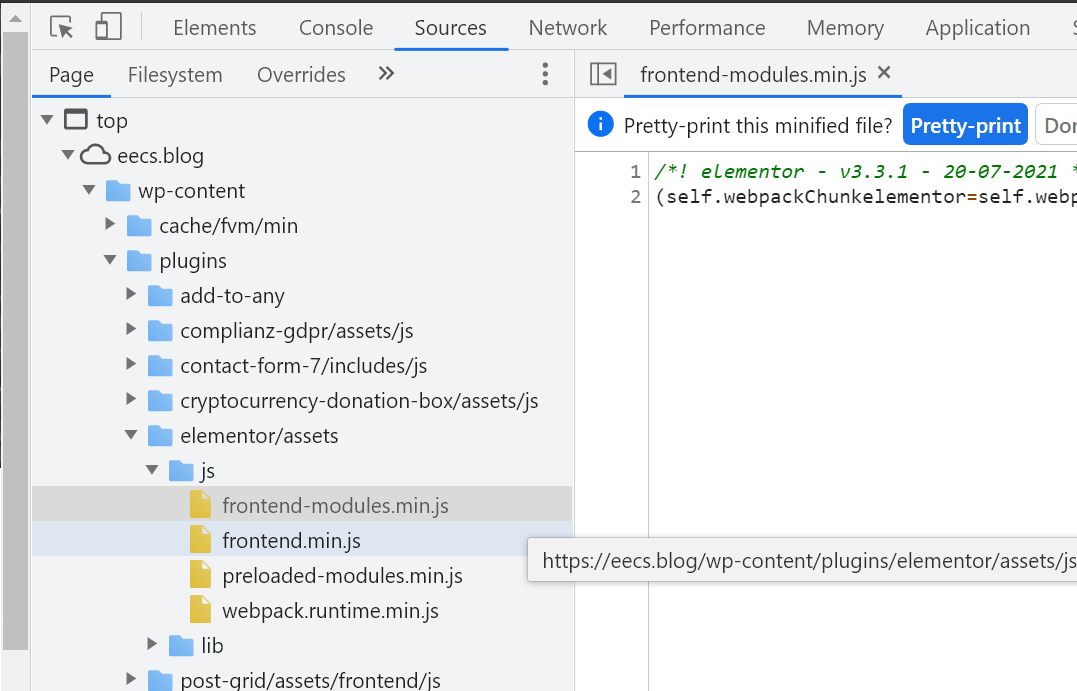
Source Files
In the Sources tab, you will be able to see and inspect all the source files loaded for your webpage. If the file contains javascript you can set a breakpoint for the debugger.
Coverage
In the Coverage tab, you can see how much JS and CSS code is actually being used for loading your webpage. By removing the unused code you can speed up the page loading time.
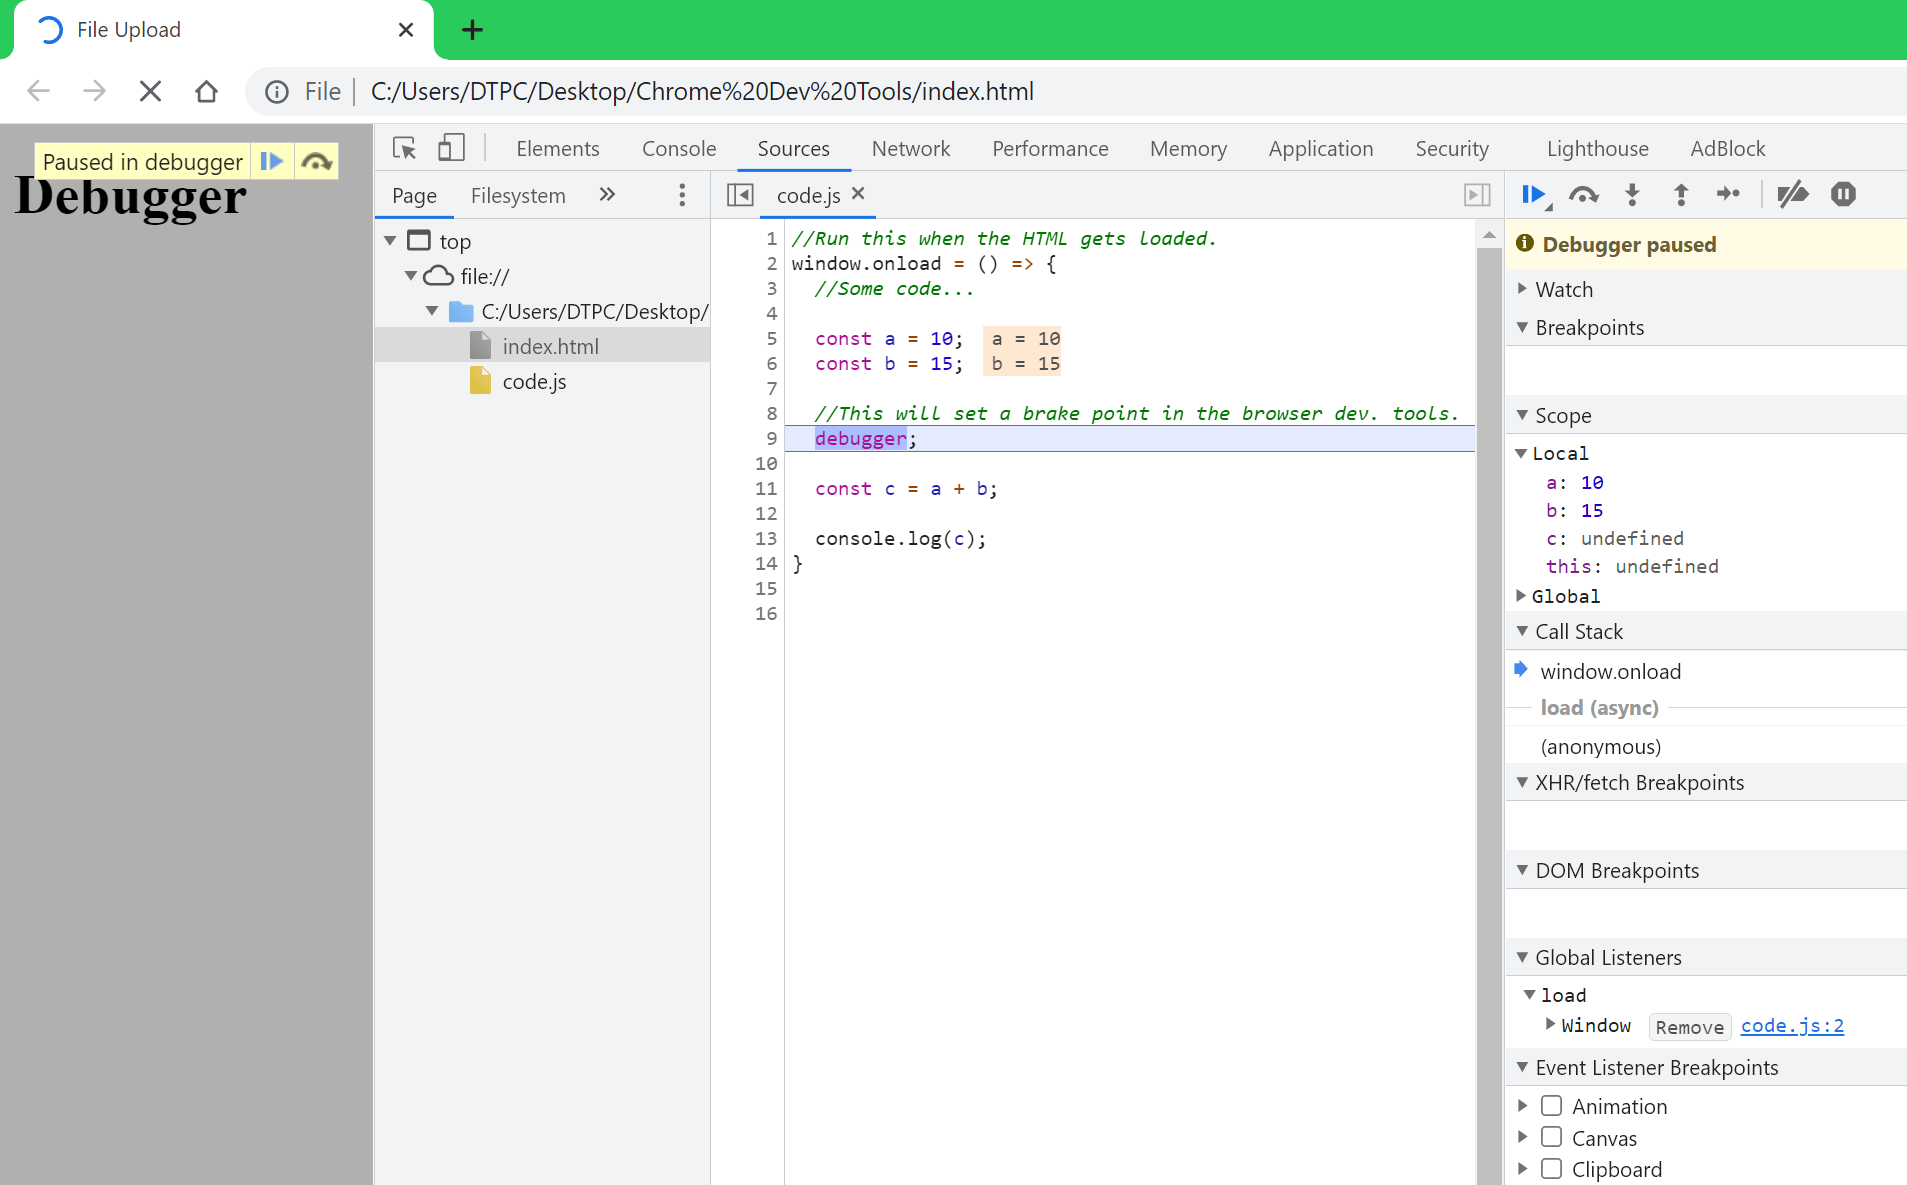
Debugger Keyword
If you put the debugger keyword into your js code the Chrome debugger will automatically stop on that line of code without you having to set a breakpoint.
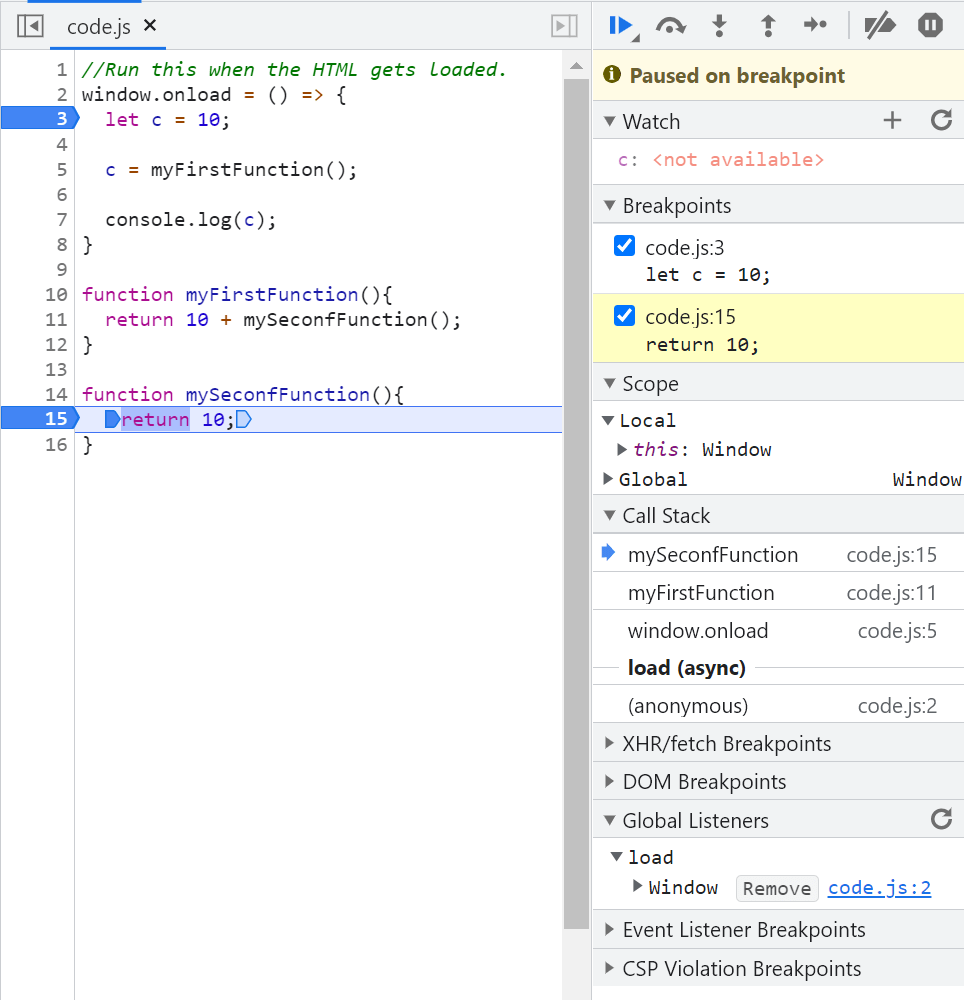
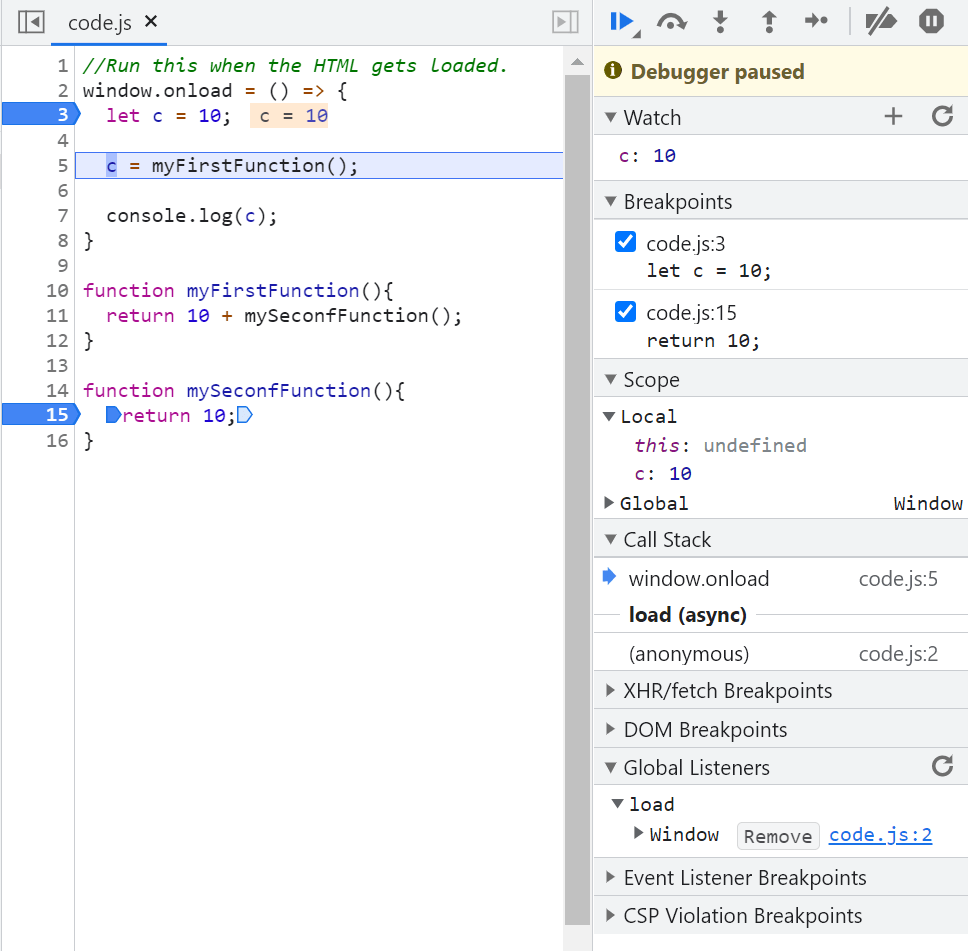
Debugger
If the code contains a debugger keyword or has a set breakpoint the debugger will stop on it. The Chrome debugger offers the standard functionality like: step into, step over, deactivate breakpoint, don’t break on exceptions, … It shows you the set breakpoints, call stack, events, variables in scope, watch window where you can pin a variable whose value you want to keep an eye on, …
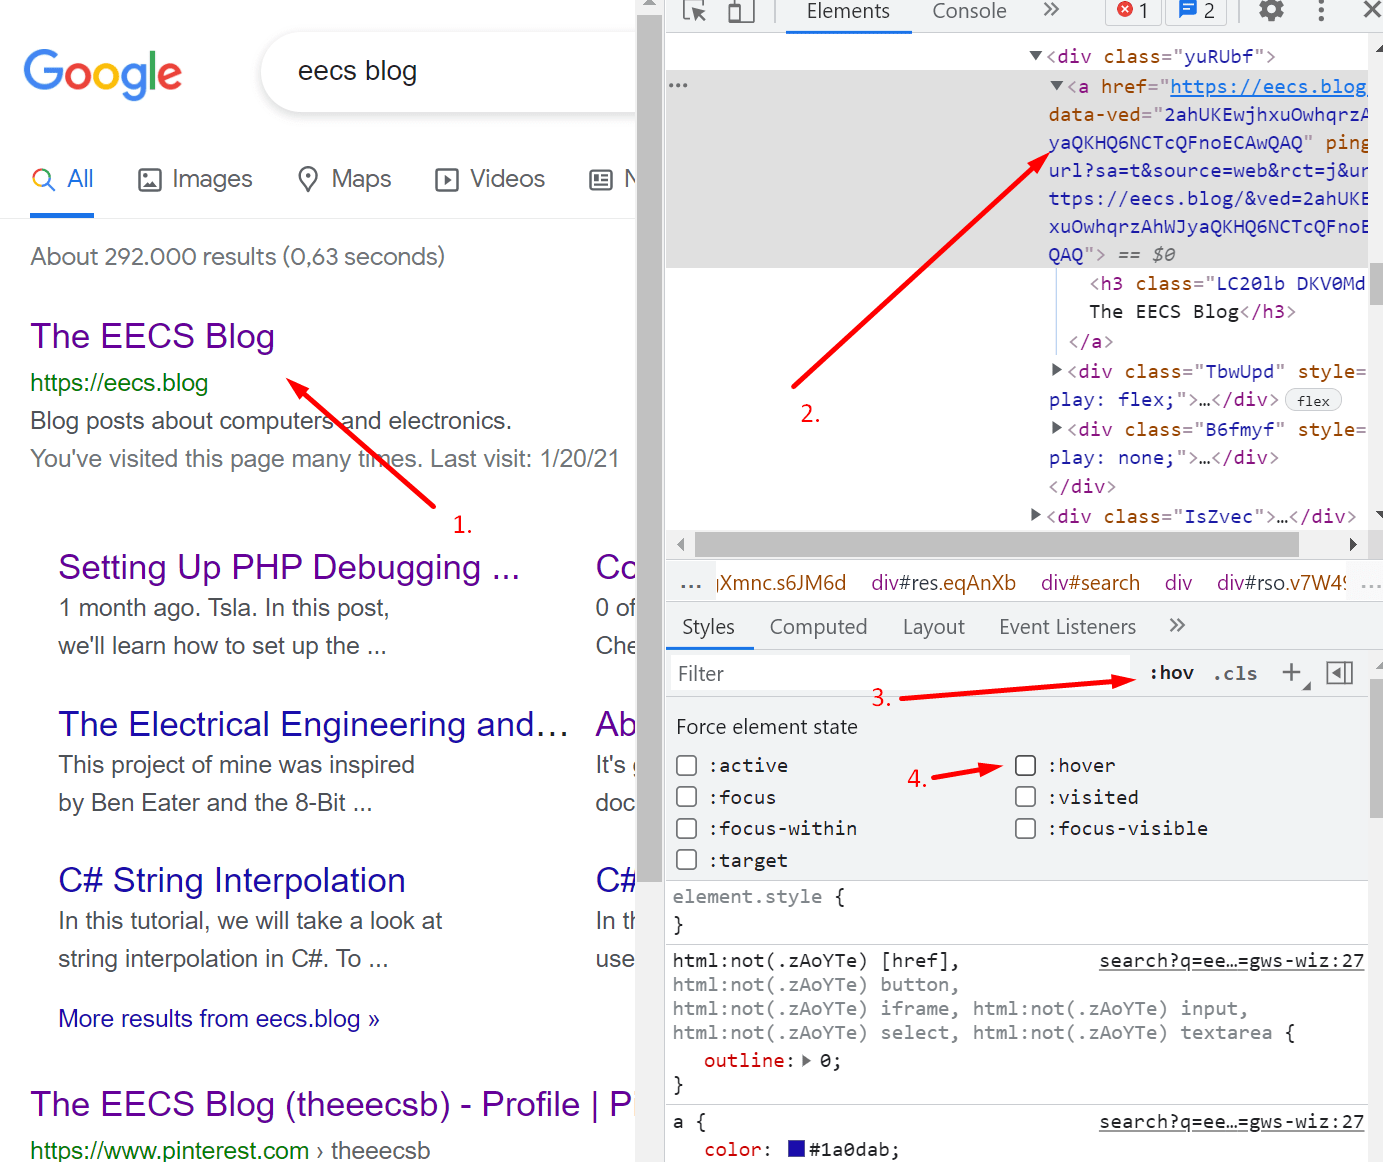
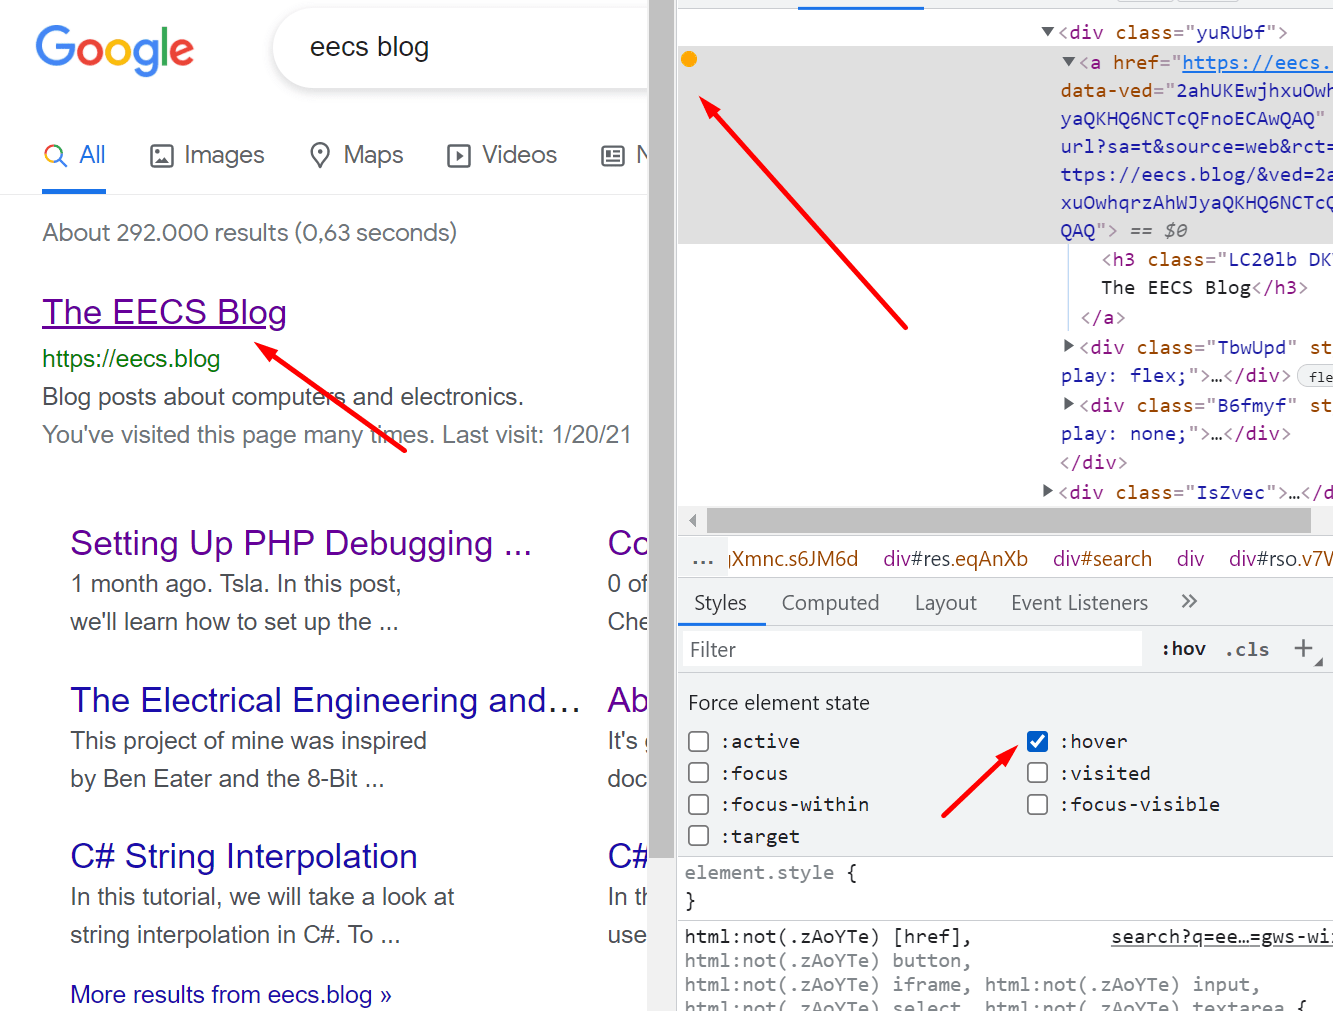
Force State
If you select an element in the Elements tab you can then click on the :hov text and set the state of an element like visited, focus, hover, …
Copy
By right-clicking an element, you will get a whole list useful of things you can do to it. The Copy submenu has this enables you to easily get a path
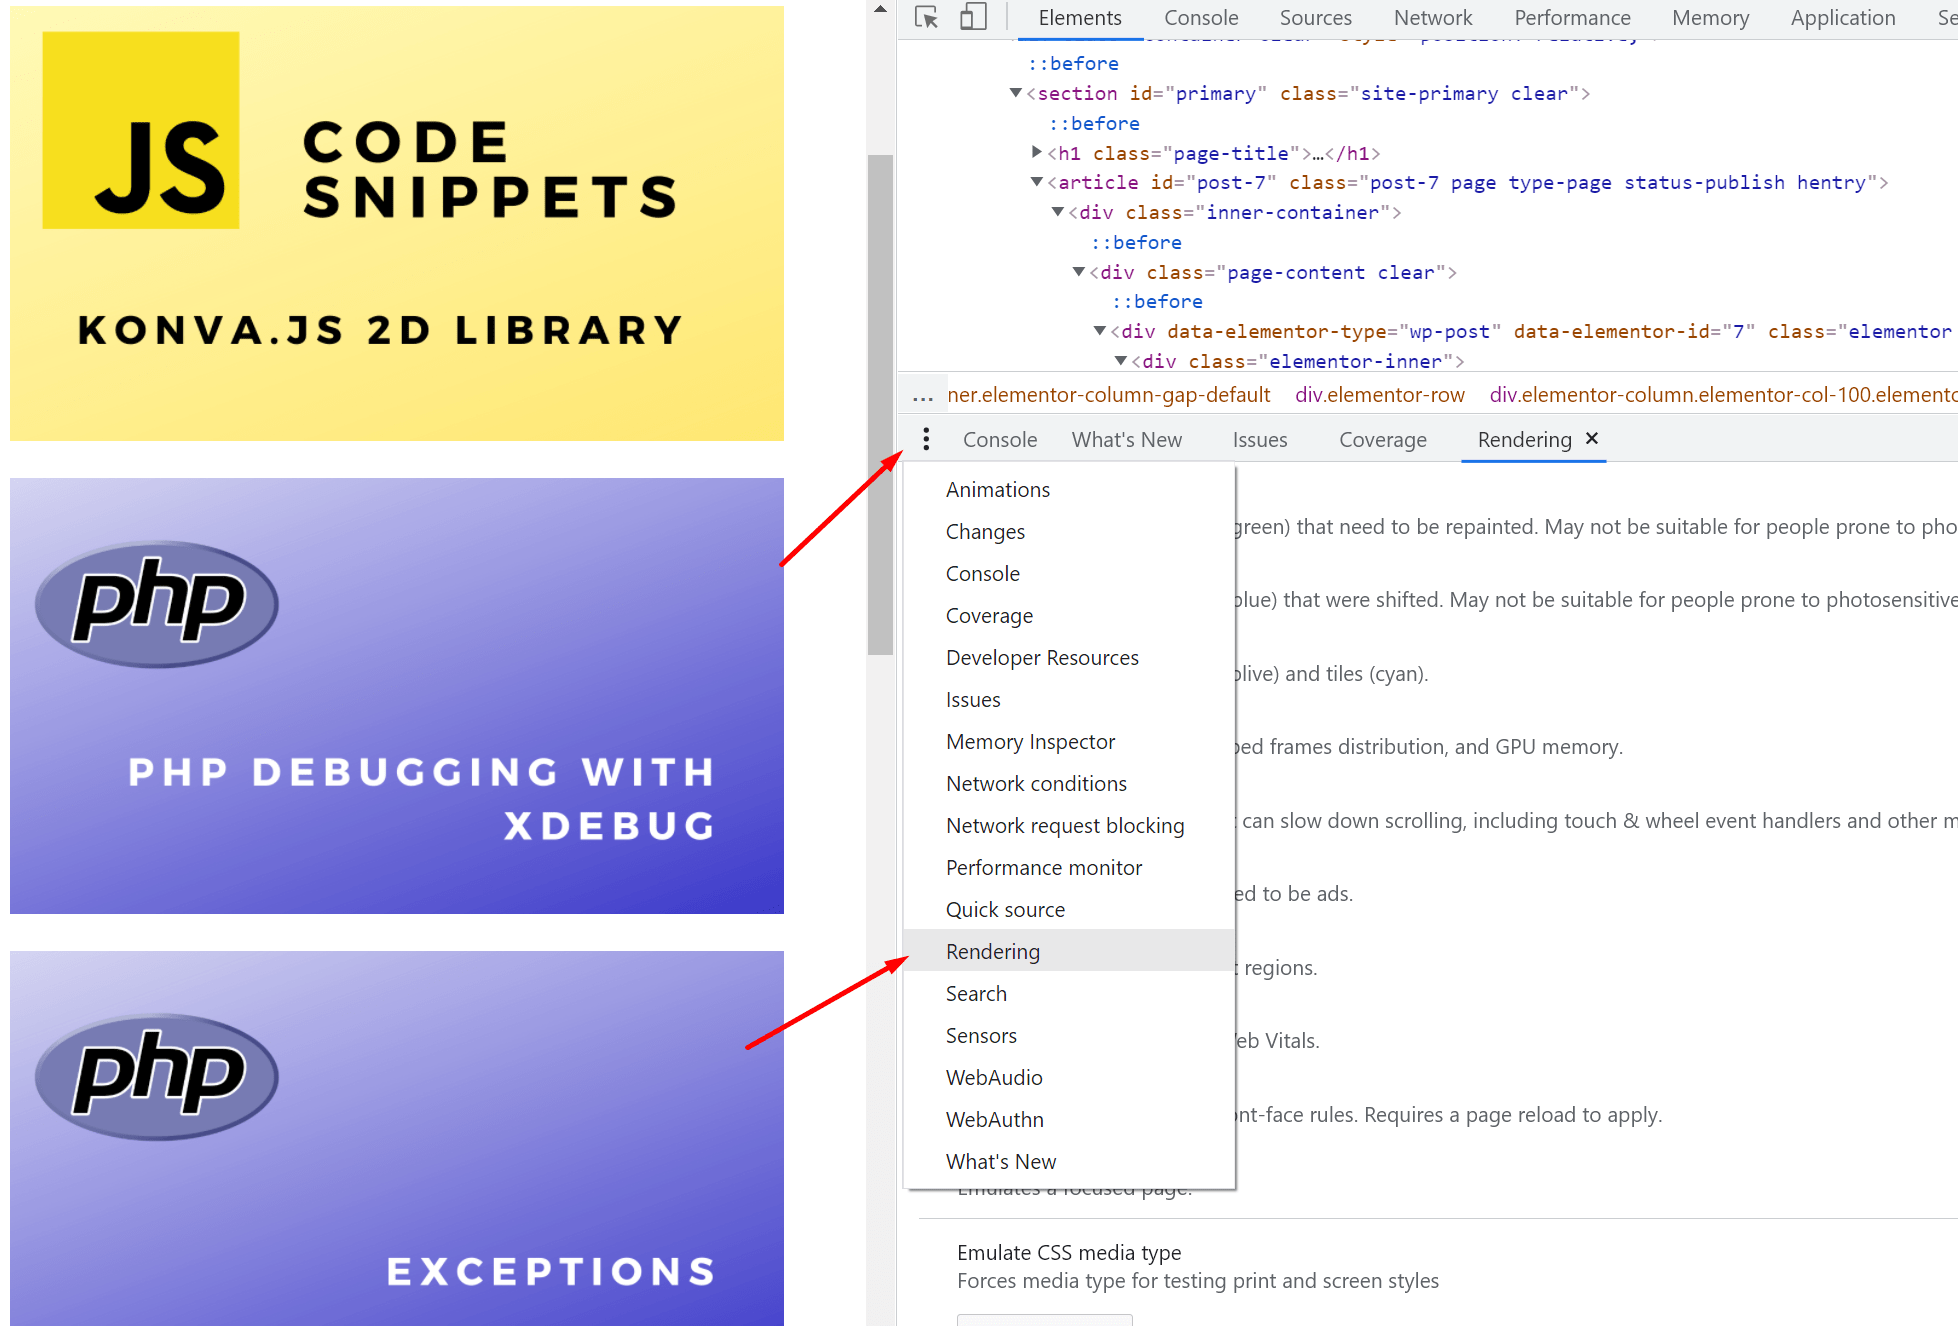
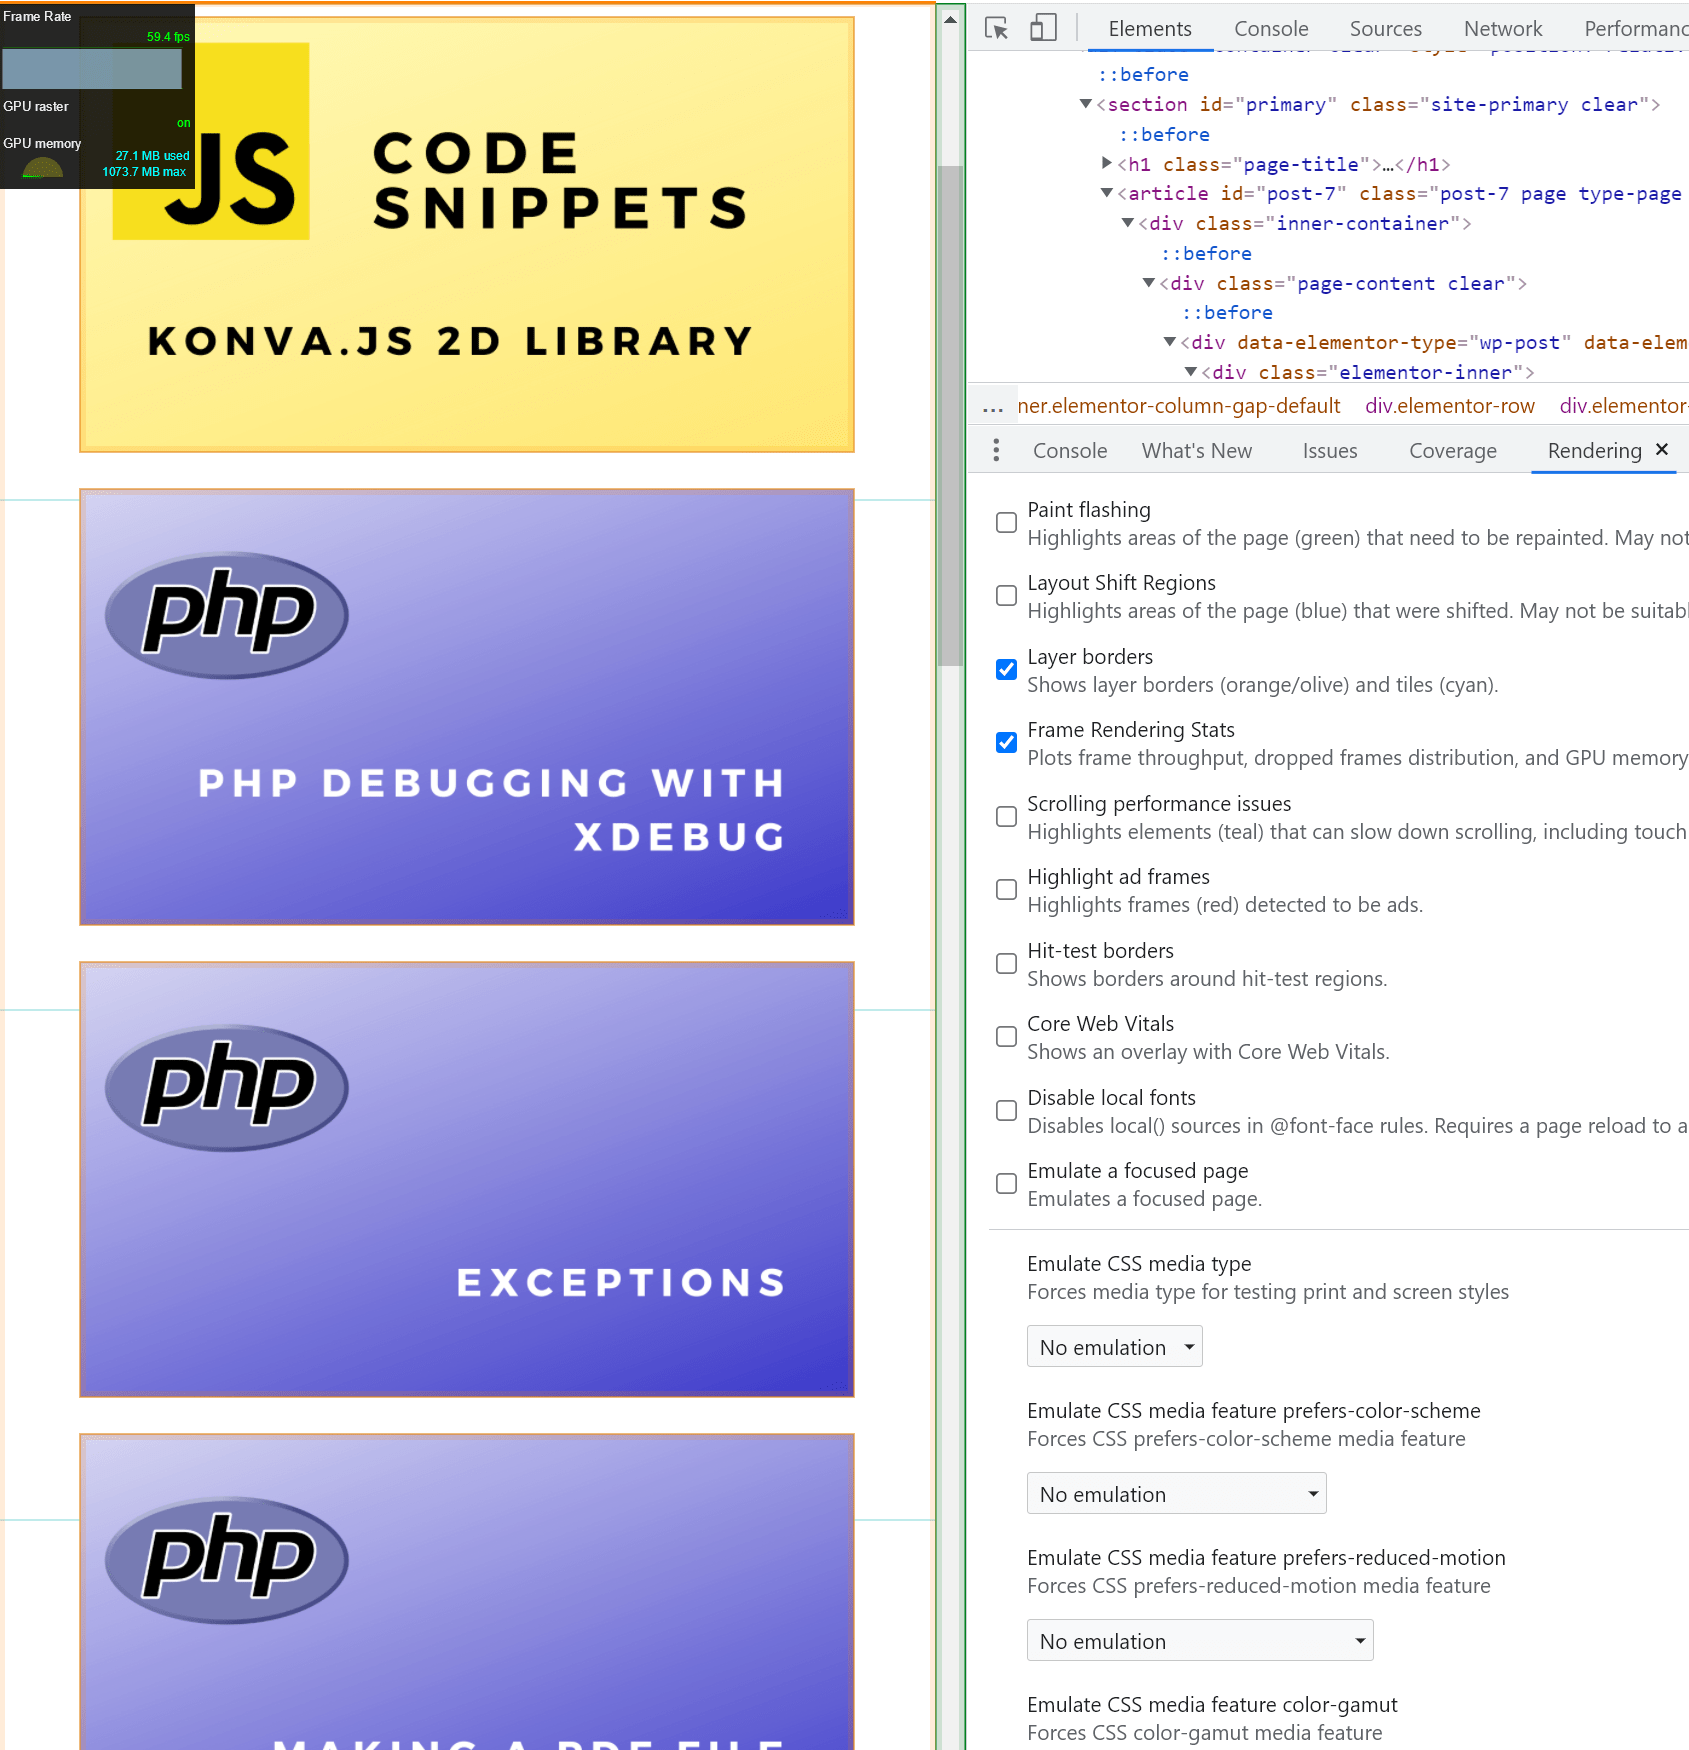
Rendering Info
To get the rendering info click the dot menu on the bottom left where you can add a Rendering tab. Then check the Frame Rendering Stats checkbox which will add a popup with rendering info like fps and GPU usage.
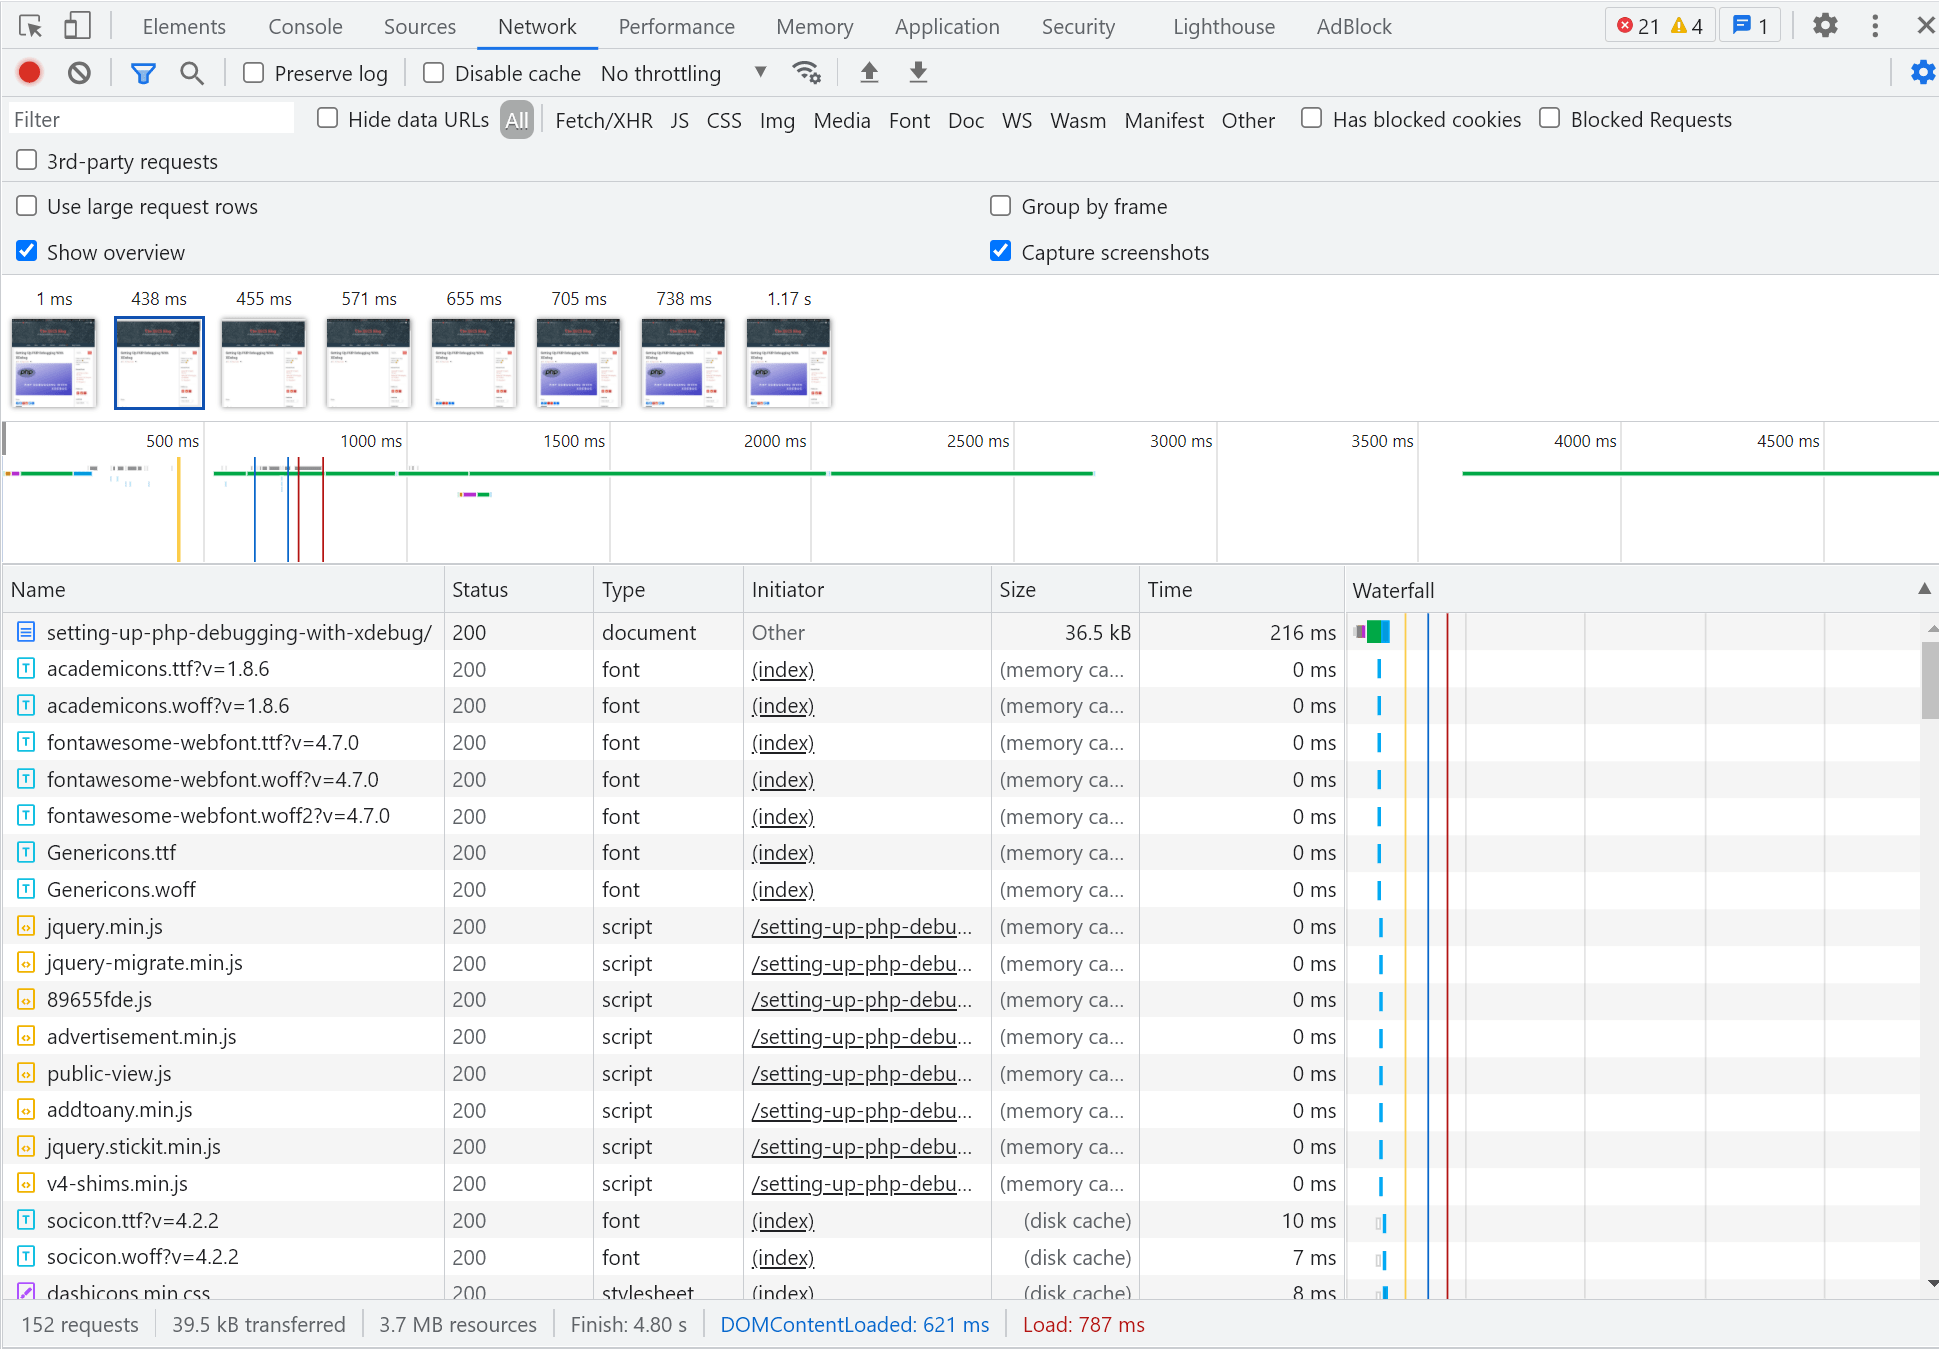
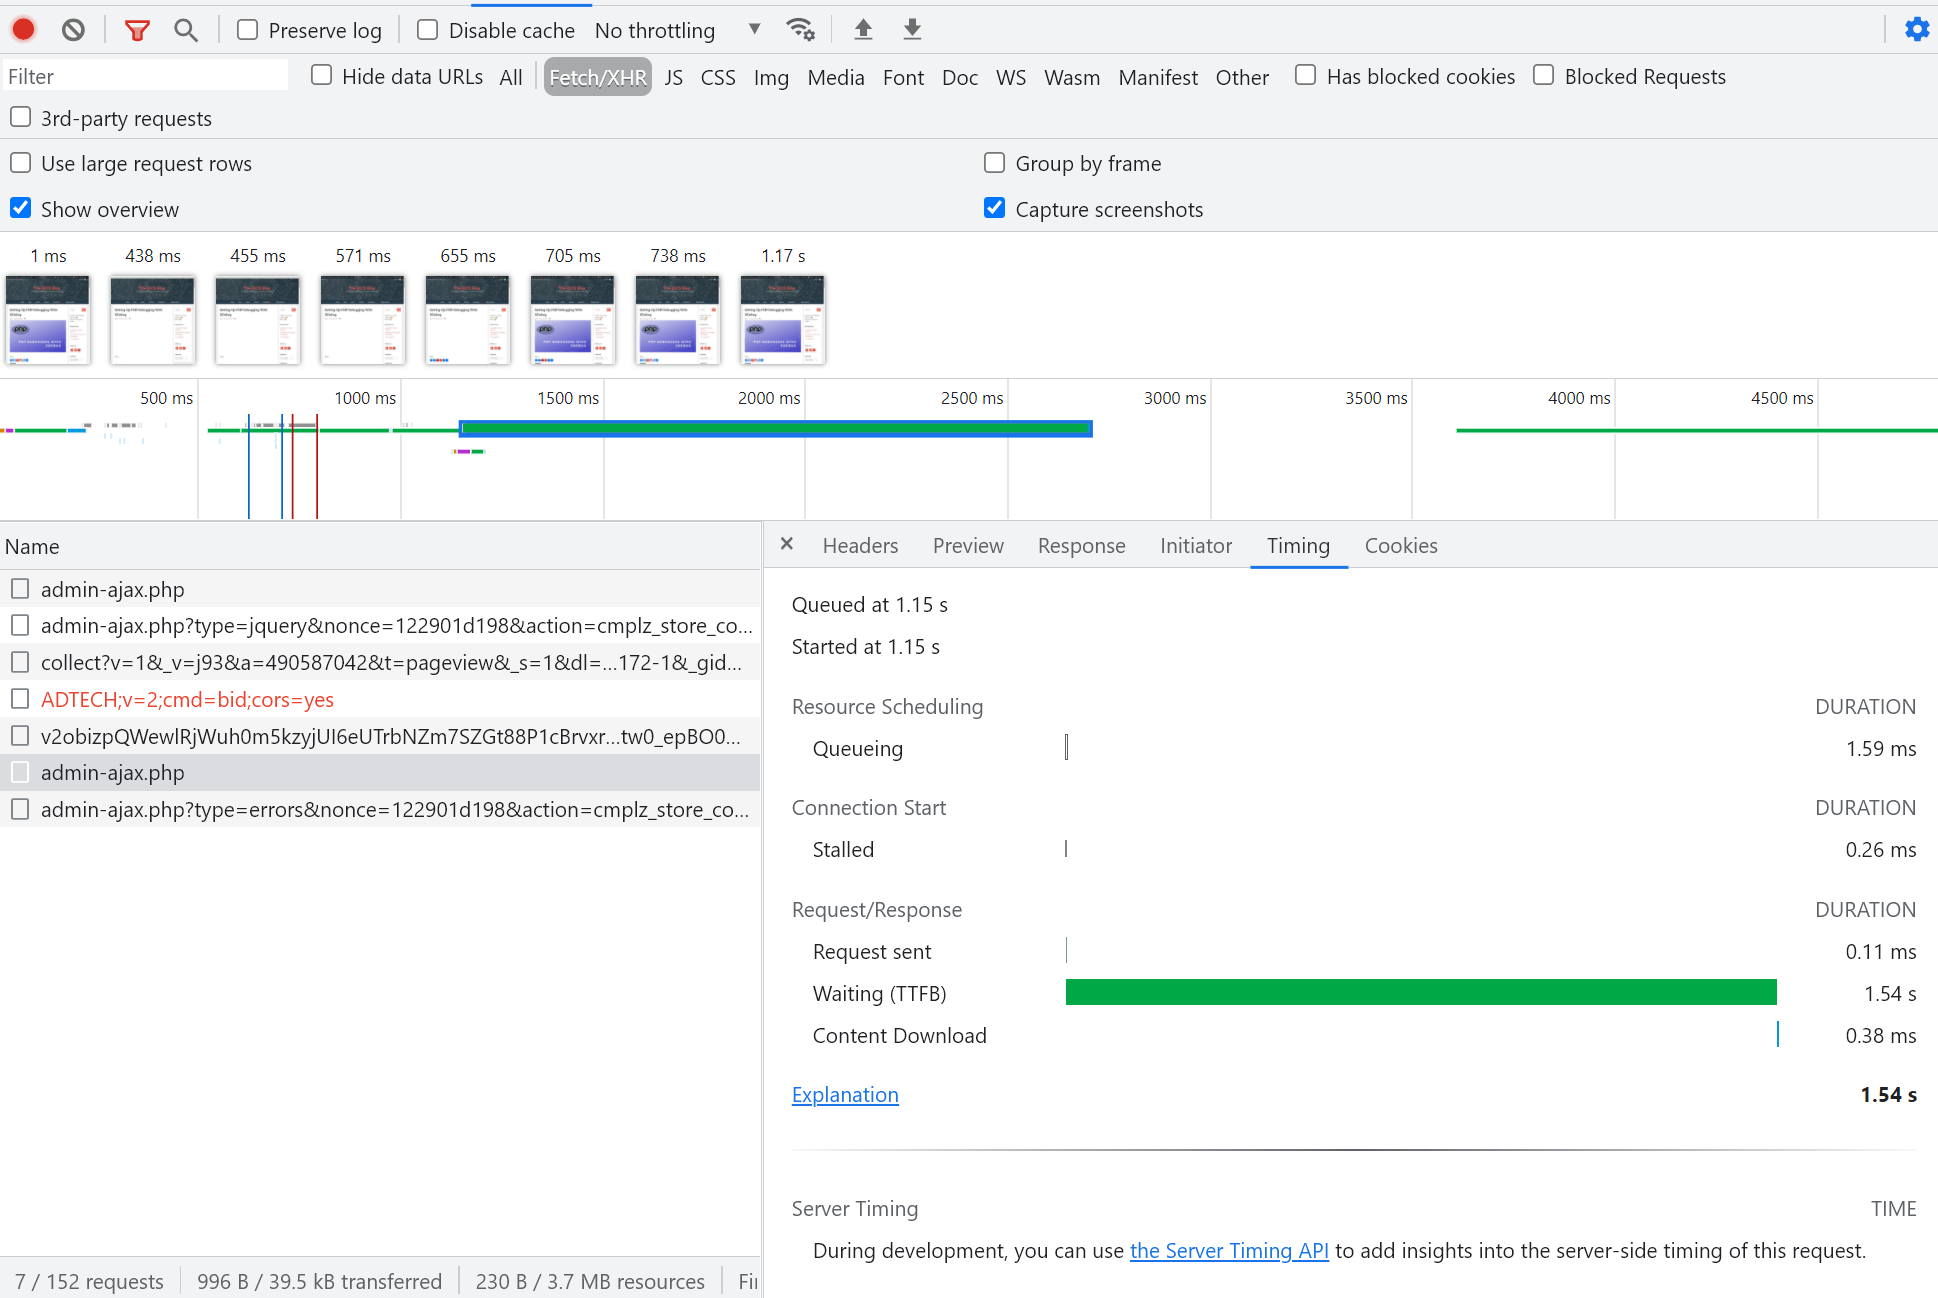
Network Traffic Info
In the Network tab, you can find a bunch of useful things like screenshots as your site loads, all the requests and loaded files with their load times. I find this especially useful for looking at API requests.
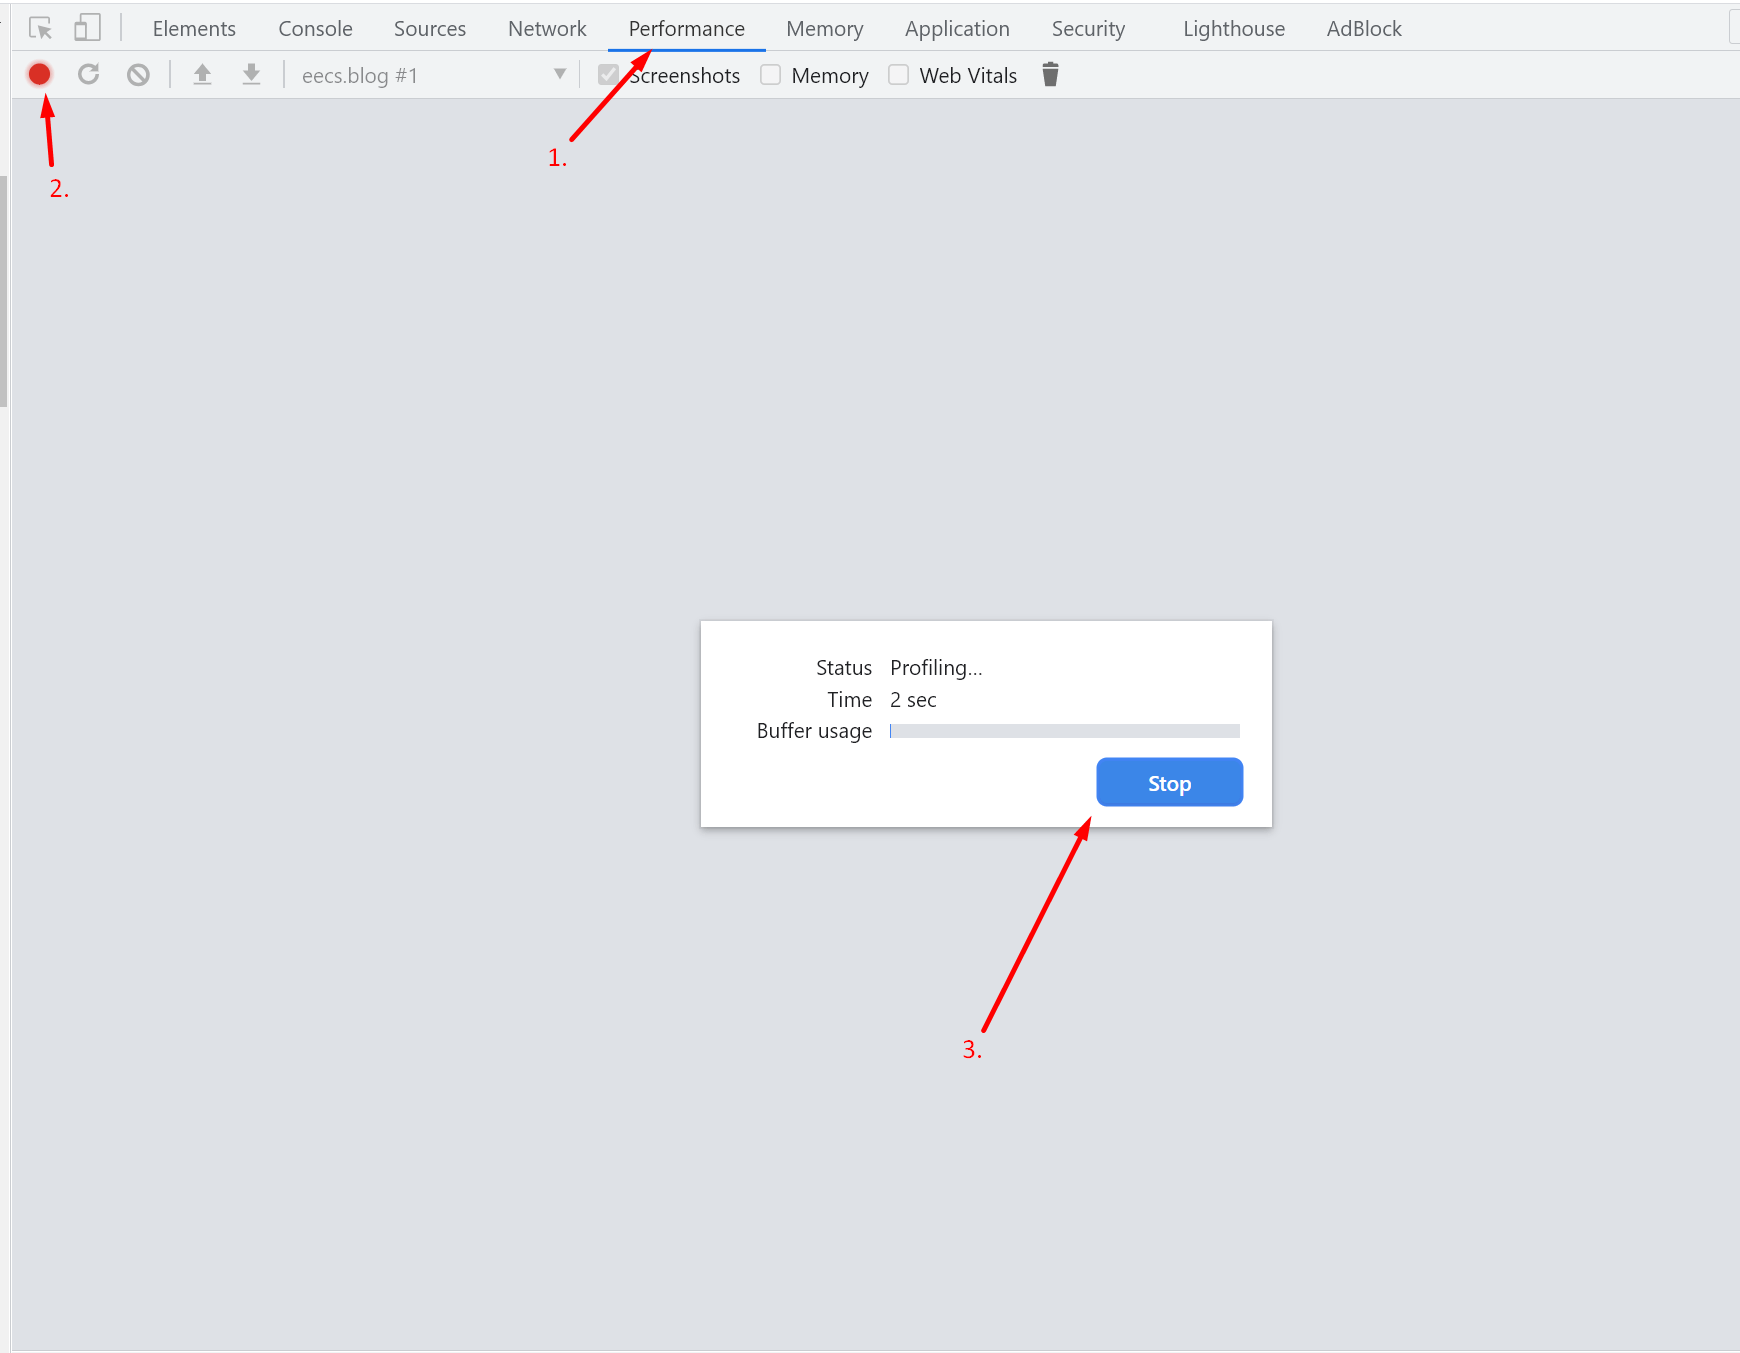
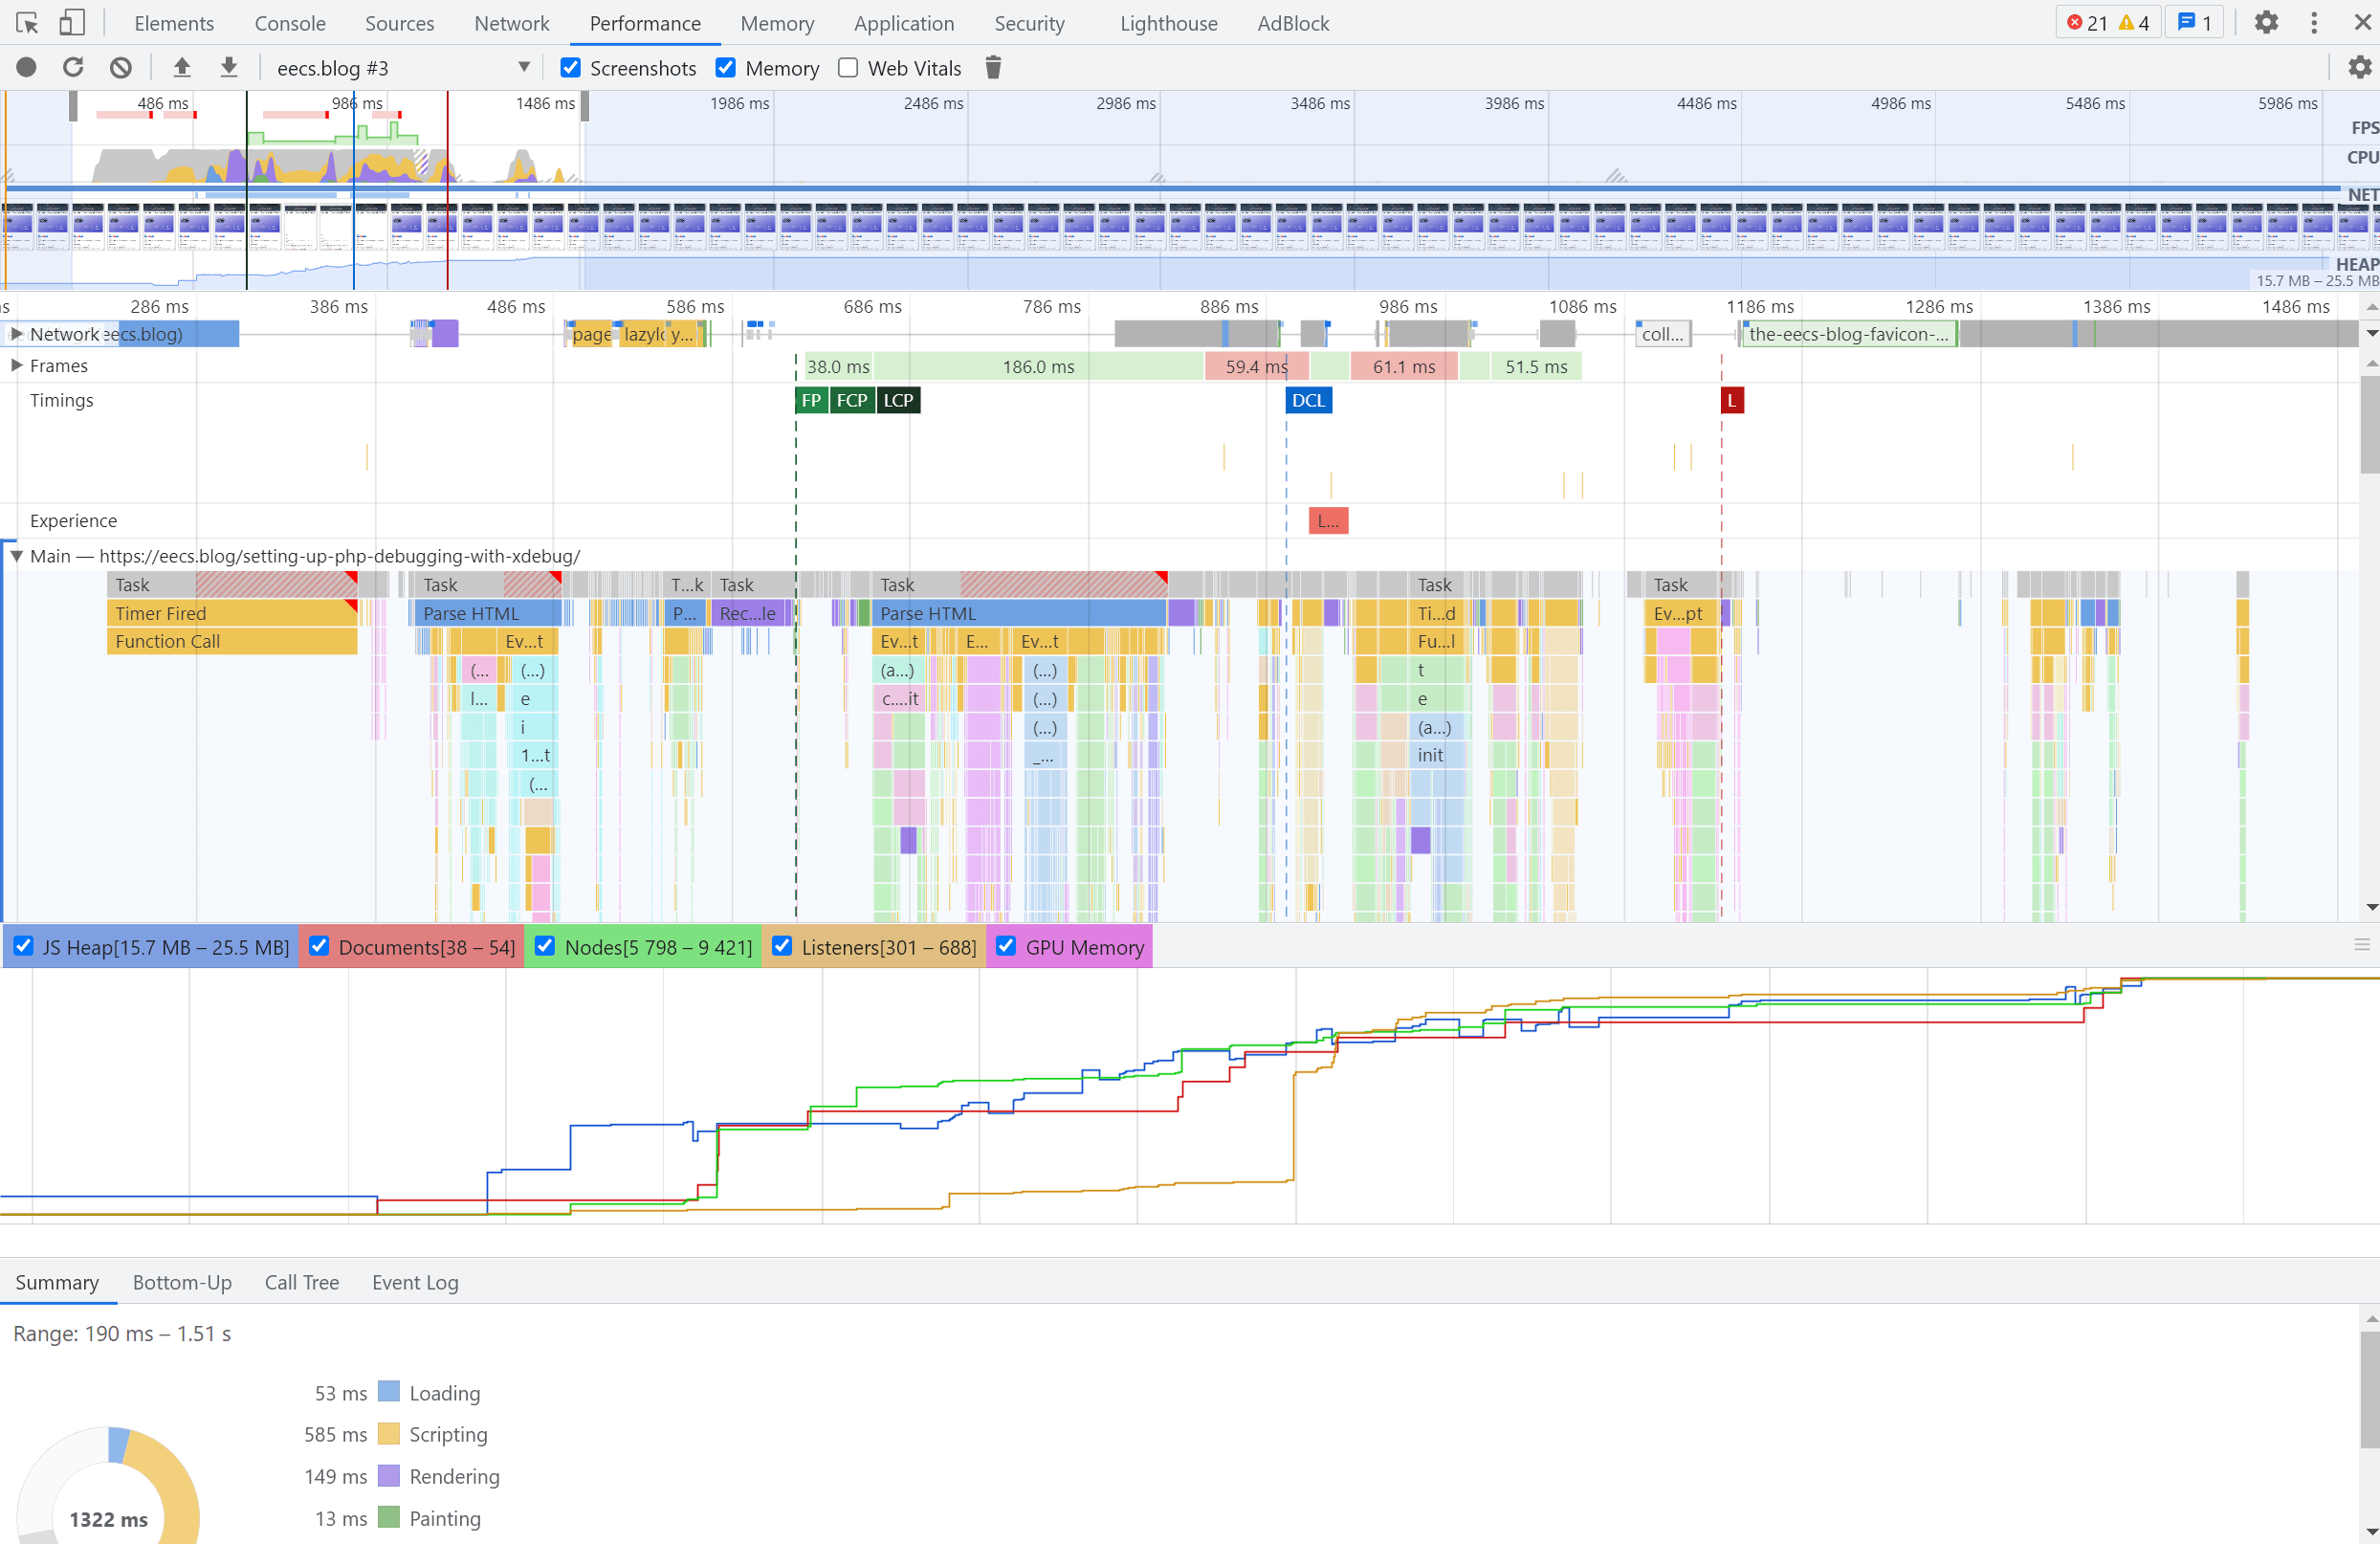
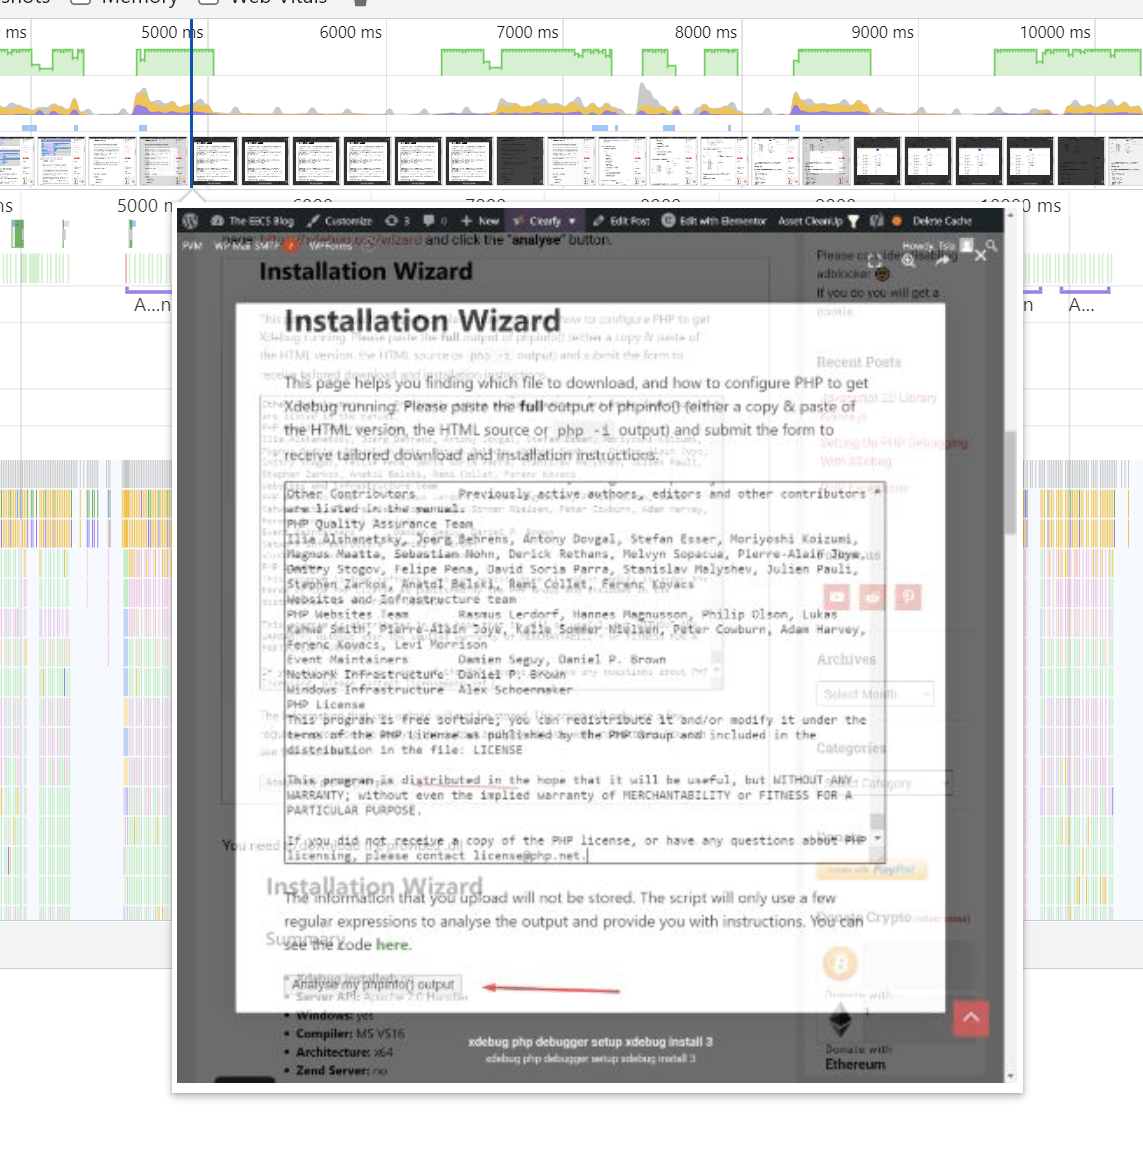
Performance Profiling
In the Performance tab, you can profile the performance of a website as it loads and as you interact with it. Metrics like memory usage, resource loading, rendering and code execution times will be logged. Also, periodic screenshots of the site will be taken.
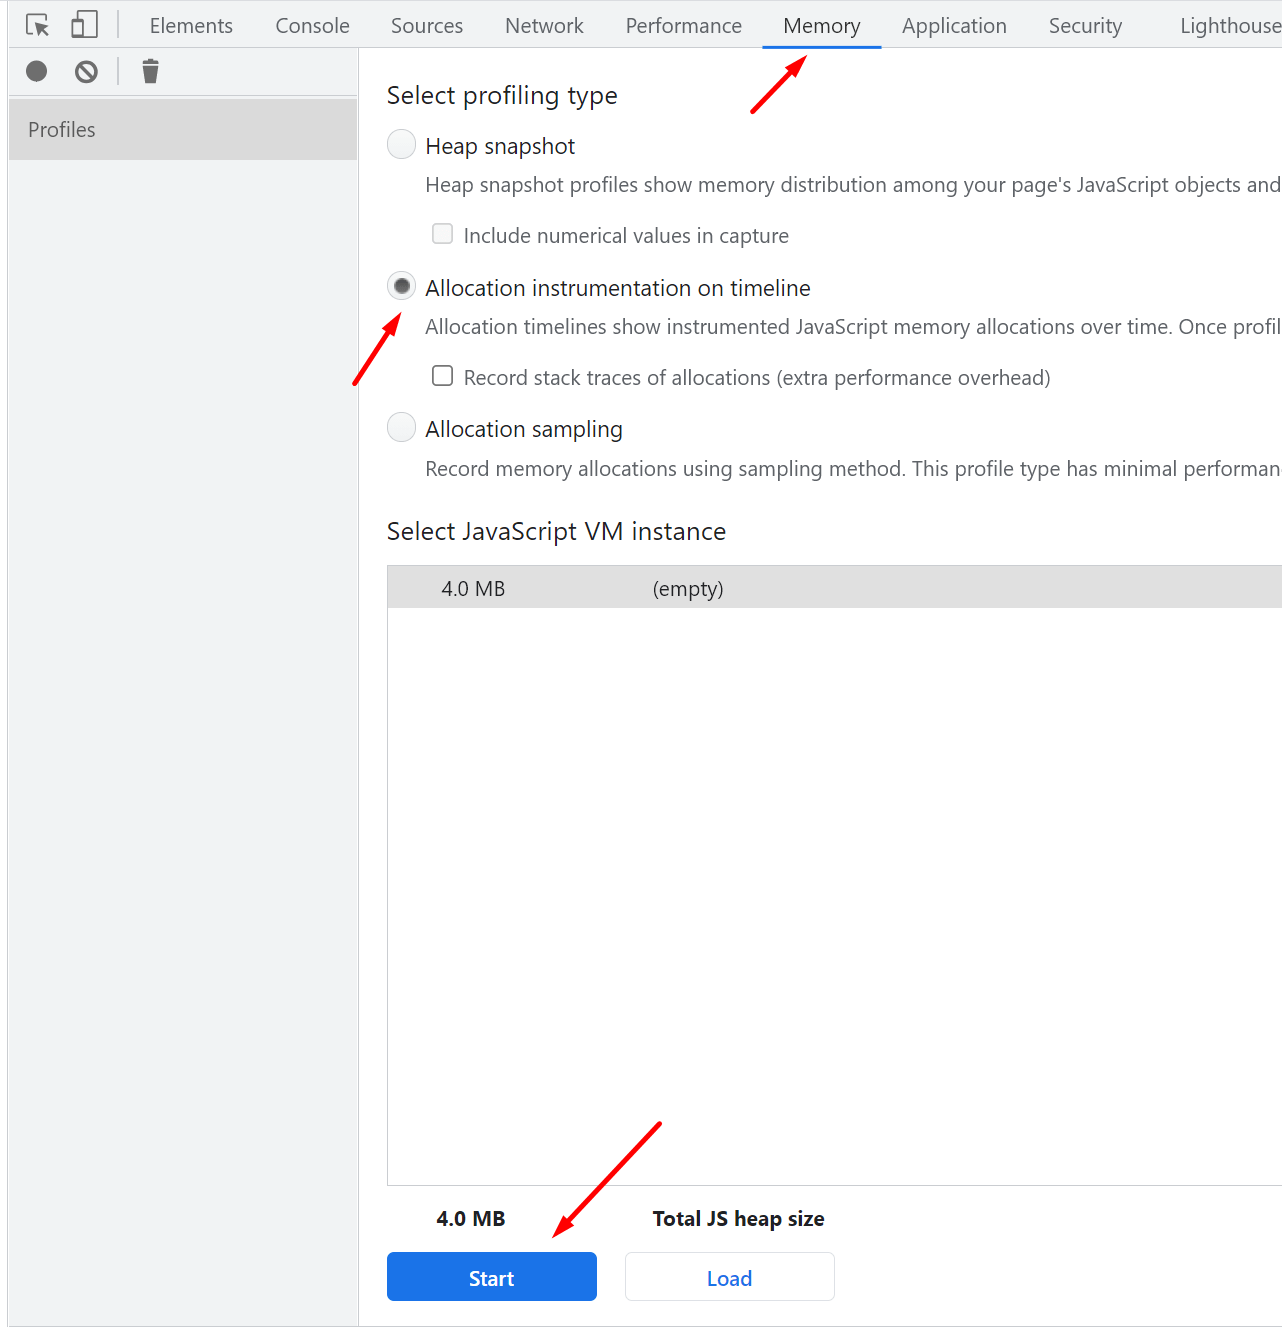
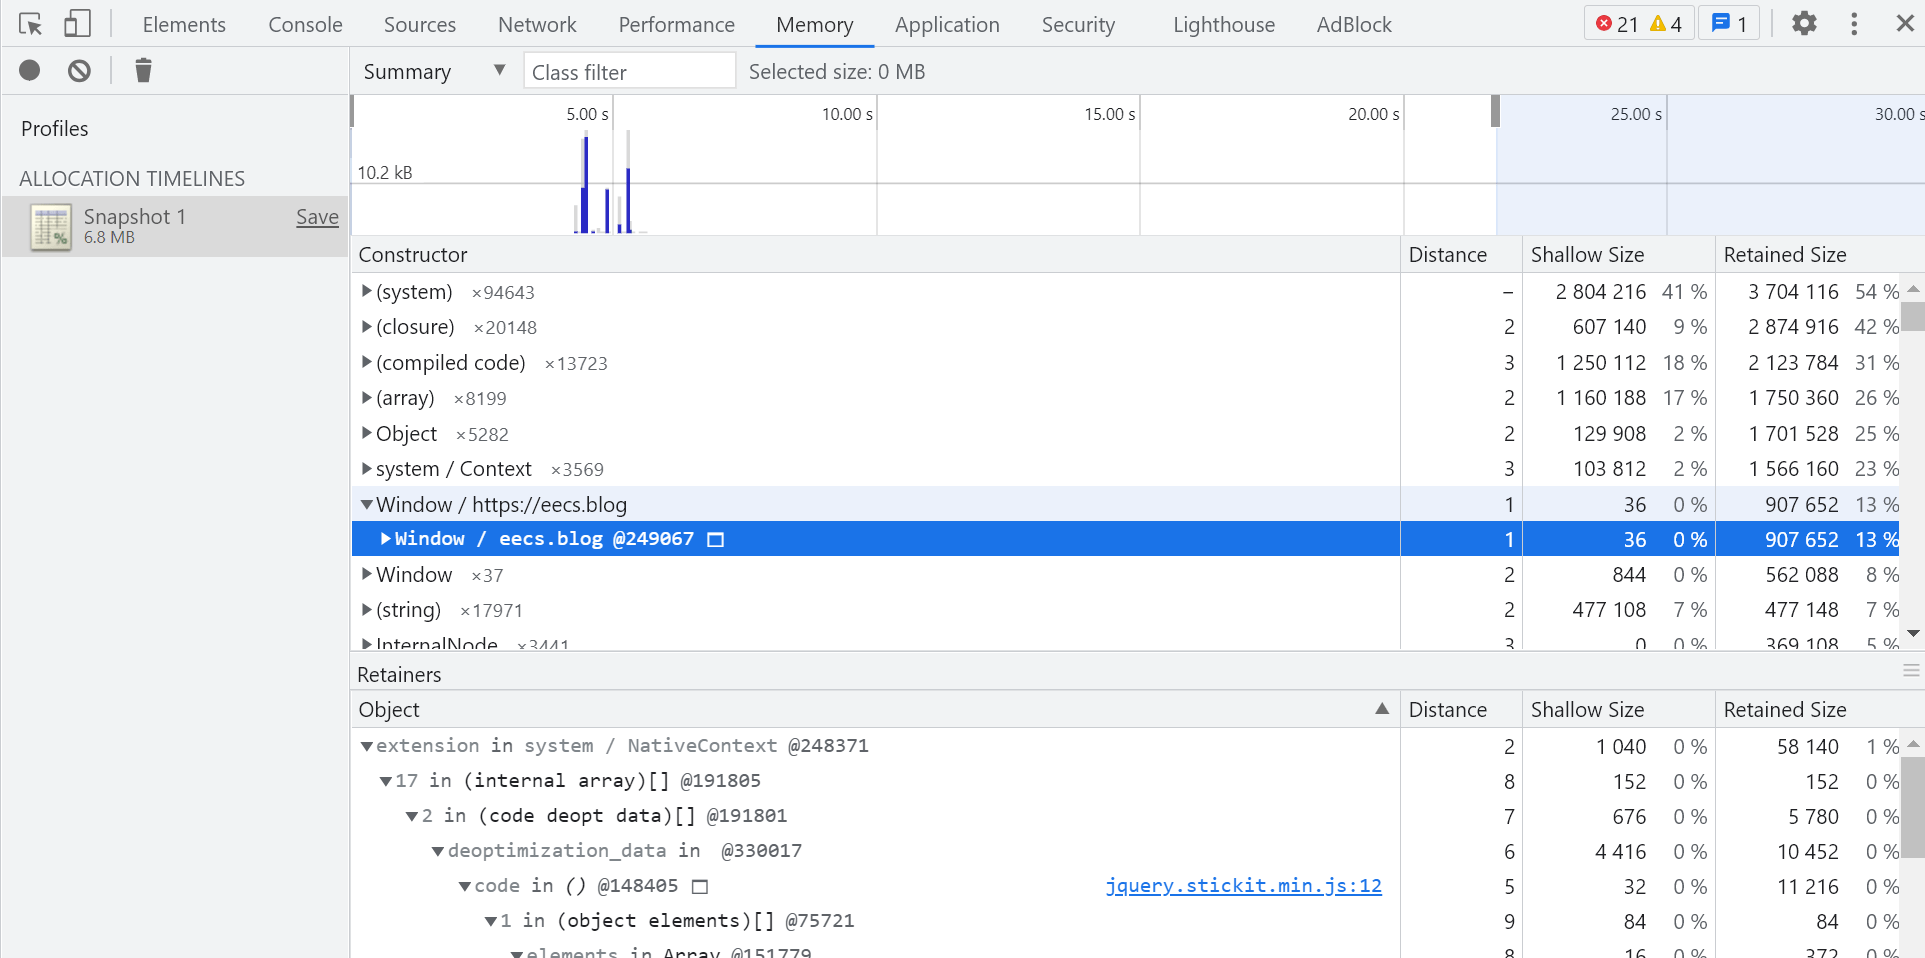
Memory Snapshot
In the Memory tab, you have the tools to take snapshots of your memory or record its usage over time while using your web app. This tool can be useful to find and pinpoint memory leaks.
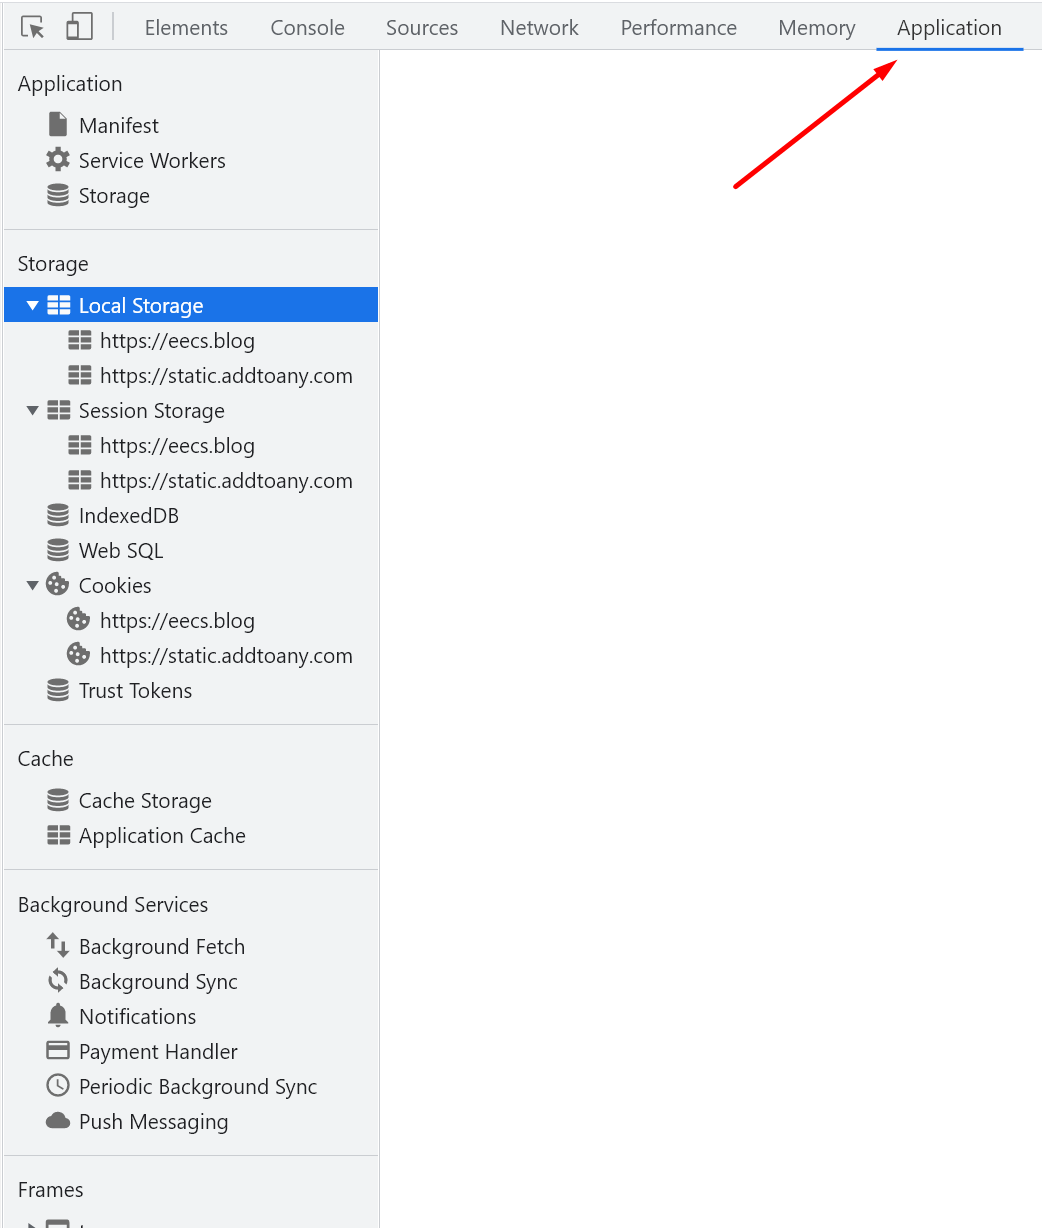
Application data
In the Application tab, you can find information about your web apps cookies, sessions, local storage, service workers, notifications, …